

From time unknown, women have been termed as the weaker gender. The perception that women are inferior makes them more vulnerable to suppression.
We find instances of atrocities against women every day in the news. I am sure that you will find the below data alarming. Isn't it agitating?
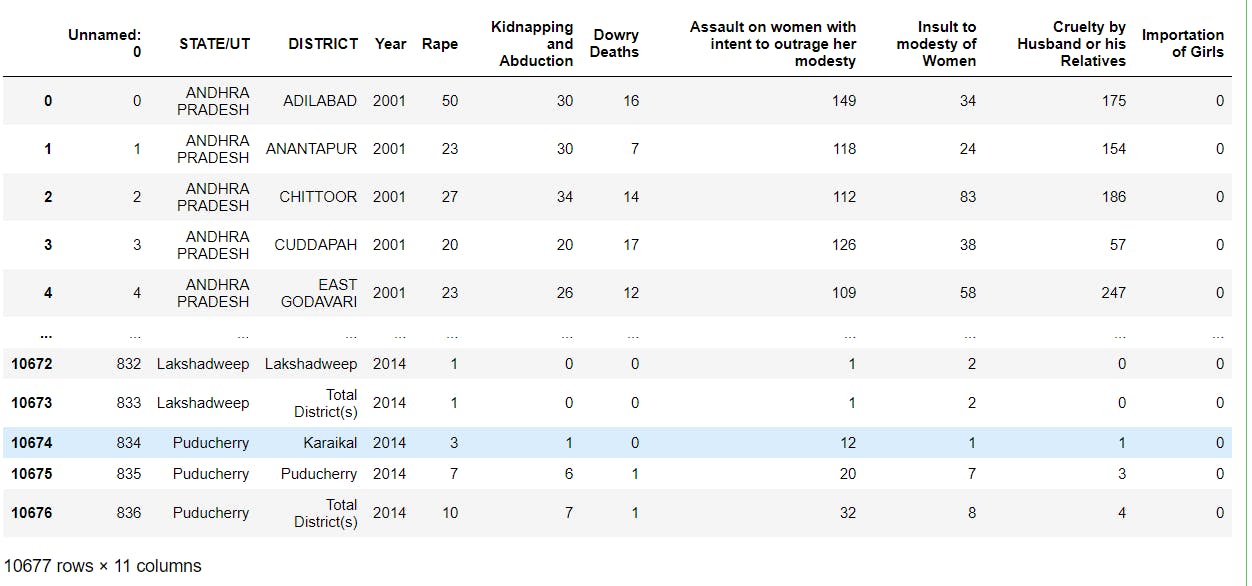
The dataset consists of crime data from 2001-2014 in various states across the country.
Dataset link - bit.ly/2R6ZXqB
Women in India face atrocities like rape, kidnapping, and abduction, dowry deaths, assault, insult to the modesty of Women, cruelty by husband or his relatives, importation of girls, etc.
In this project, I will attempt to discover the factual data on the states with the highest crime rate against women, year over year increase in the crimes, count of each crime within the country classified on the basis of individual states as well.
Libraries :
Pandas - provides several methods for reading data in different formats.
Matplotlib and seaborn - used for plotting basic and advanced visualizations respectively.
NumPy - used for working with arrays.
import pandas as pd
import matplotlib.pyplot as plt
import seaborn as sns
import numpy as np
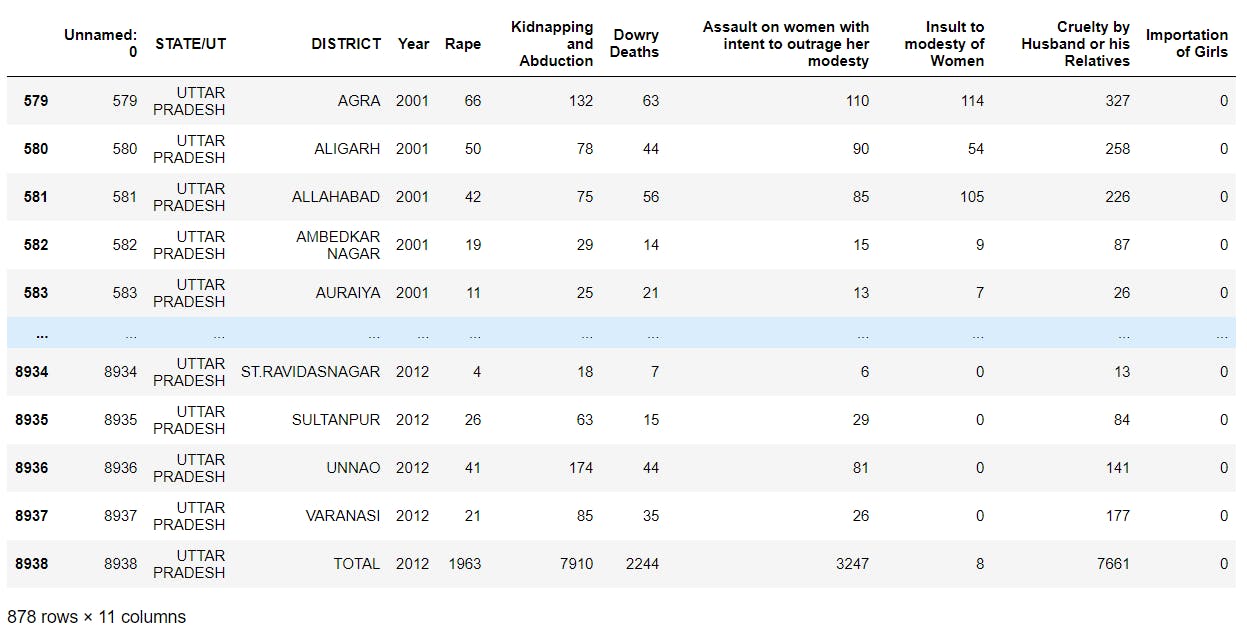
Reading and displaying the data :
crime_df = pd.read_csv("crimes_against_women_2001-2014.csv")
crime_df
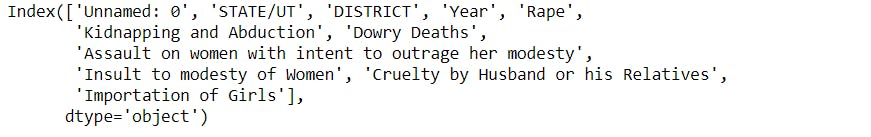
Names of columns in dataframe :
crime_df.columns
Data Analysis :
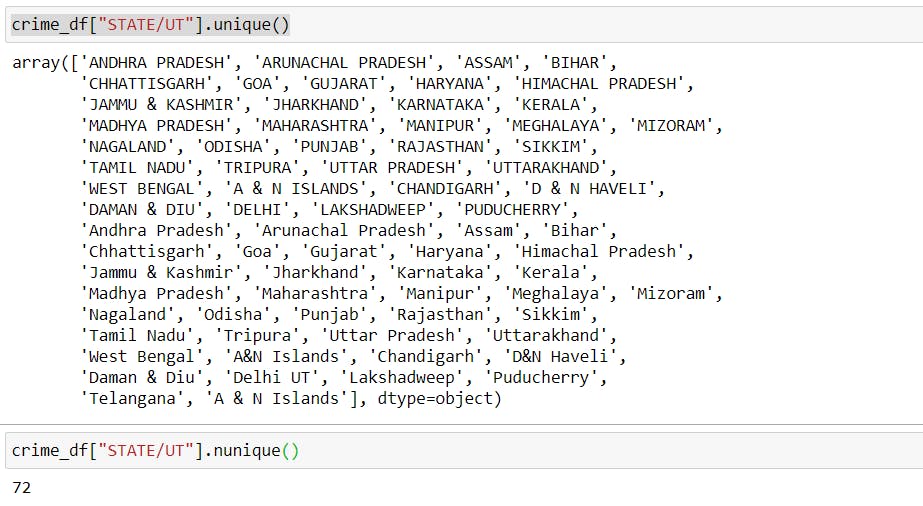
STATE/UT Analysis -
- To identify all the unique states present in the column and their corresponding counts.
crime_df["STATE/UT"].unique()
crime_df["STATE/UT"].nunique()
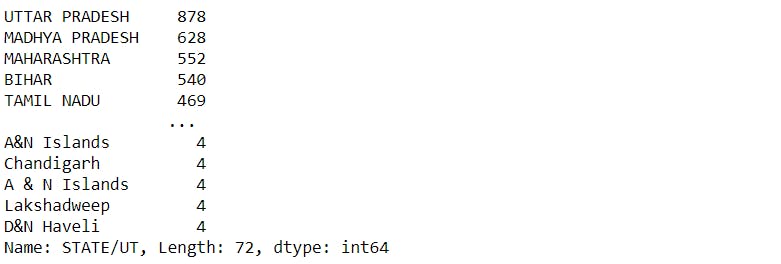
crime_state = crime_df["STATE/UT"].value_counts()
crime_state
plt.figure(figsize = (18,8))
plt.bar(crime_state.index, crime_state.values)
plt.xticks(rotation = 90)
plt.show()
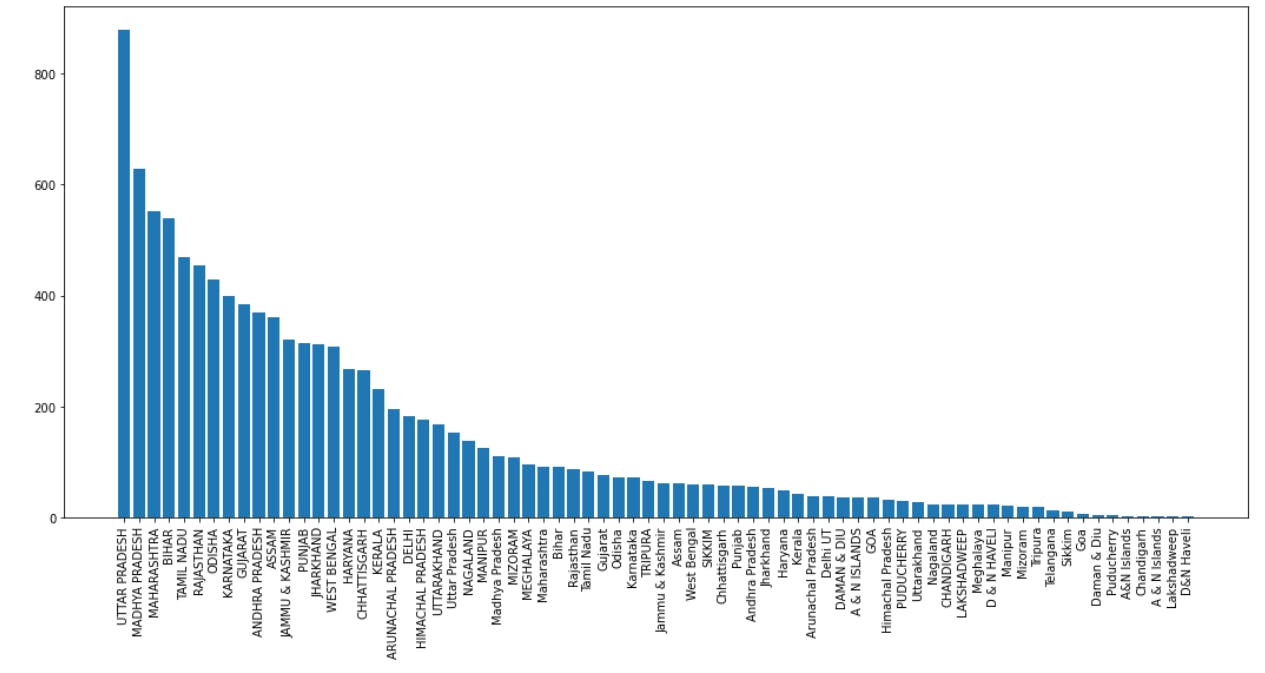 We can observe that Uttar Pradesh records the highest crimes against women followed by Madhya Pradesh and Maharashtra.
District Analysis -
- Number of unique districts in the column and their corresponding counts.
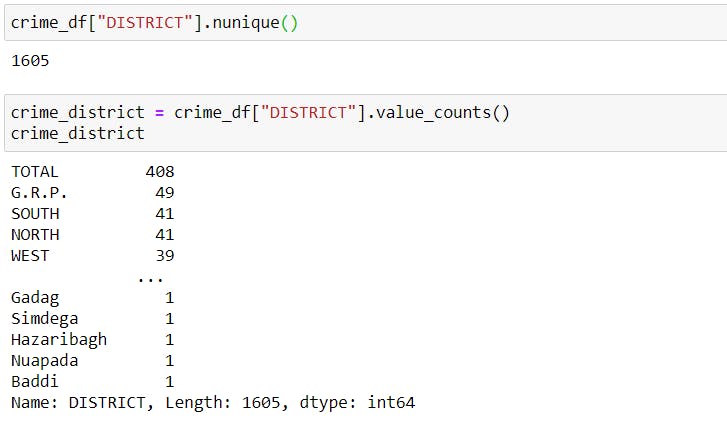
crime_df["DISTRICT"].nunique()
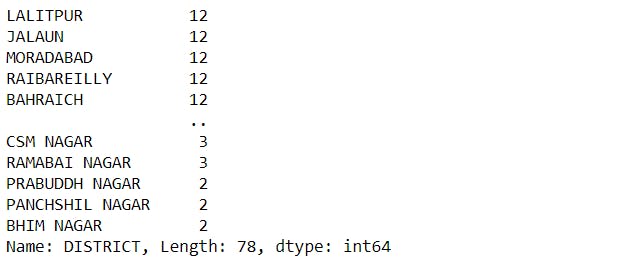
crime_district = crime_df["DISTRICT"].value_counts()
crime_district
plt.figure(figsize = (18,8))
plt.bar(crime_district.index[1:50], crime_district[1:50].values)
plt.title("Top 50 districts")
plt.xticks(rotation = 90)
plt.show()
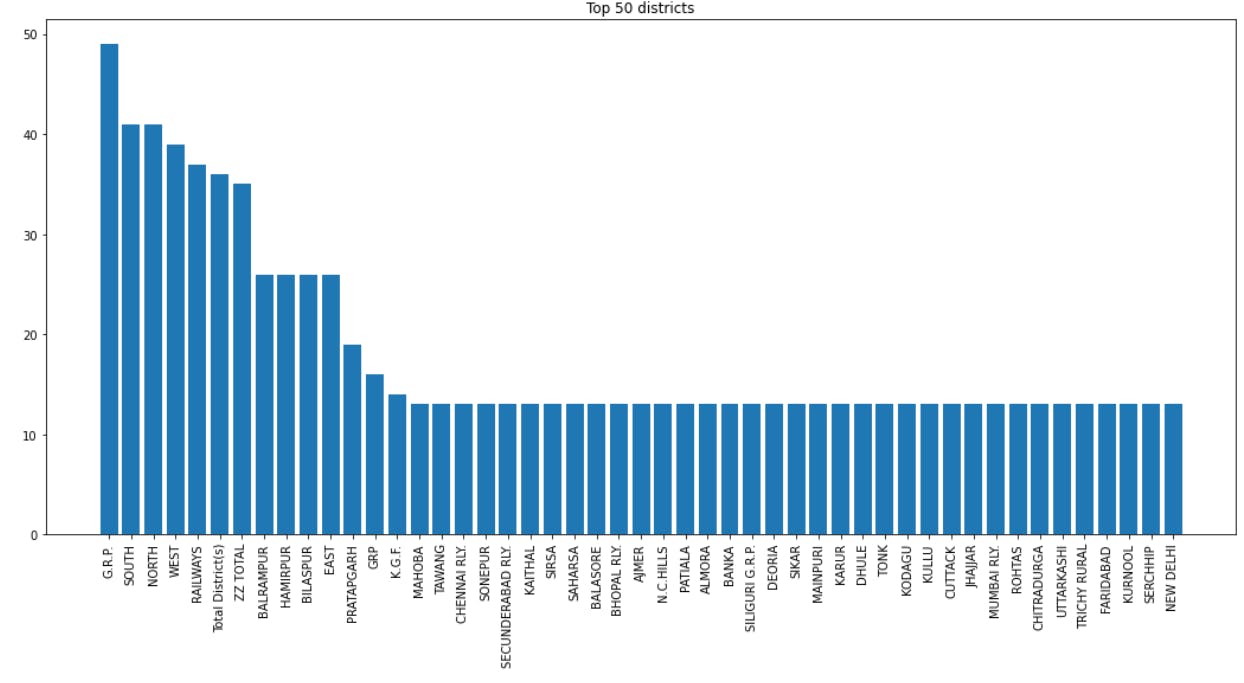 These 50 districts have the highest crime rates against women and hence they are unsafe.
crime_district1 = crime_df["DISTRICT"].value_counts().tail(50)
crime_district1
plt.figure(figsize = (18,8))
plt.bar(crime_district1.index, crime_district1.values)
plt.title("Bottom 50 districts - Safe")
plt.xticks(rotation = 90)
plt.show()
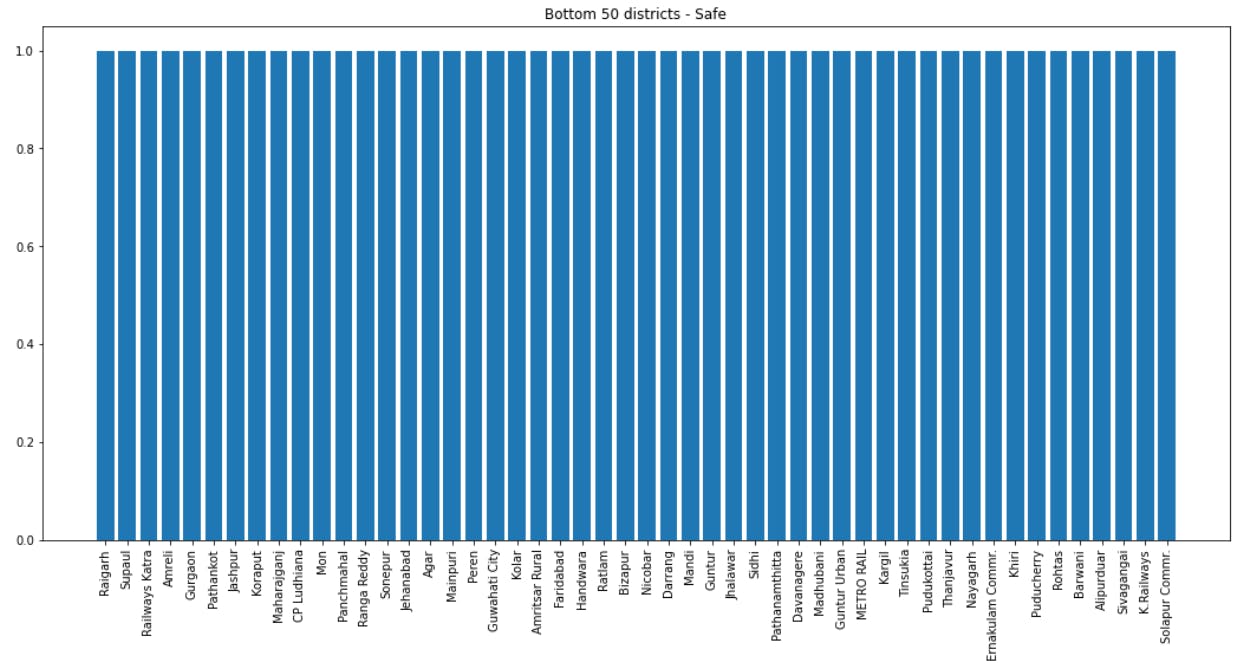 These districts are safer as compared to others as there are minimal cases recorded against women.
Year Analysis -
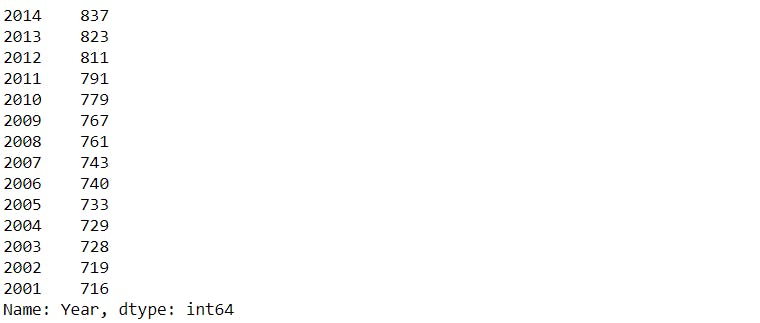
crime_year = crime_df["Year"].value_counts()
crime_year
plt.figure(figsize = (10,8))
plt.bar(crime_year.index, crime_year.values)
plt.xticks(crime_year.index)
plt.show()
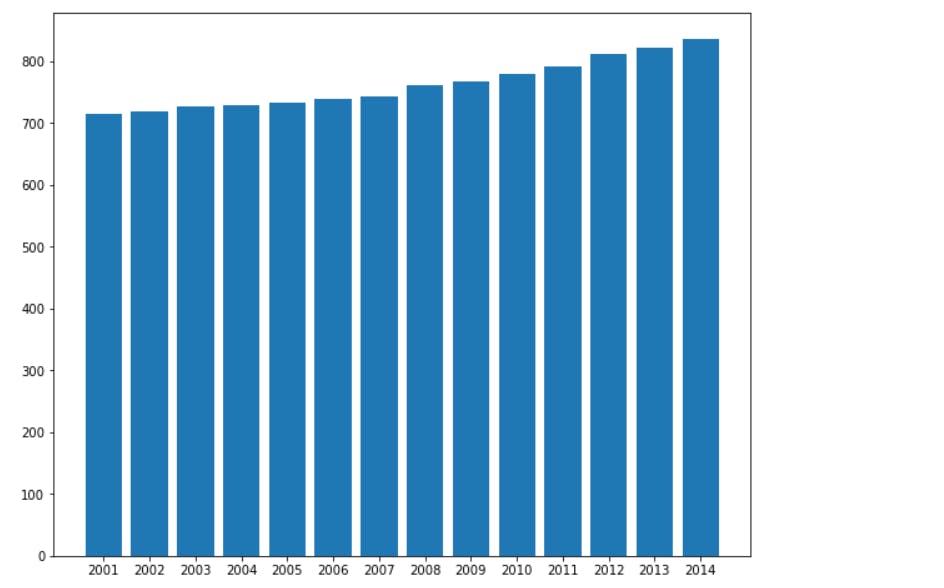 It is evident that the number of crimes against women has kept on increasing from 2001 till 2014.
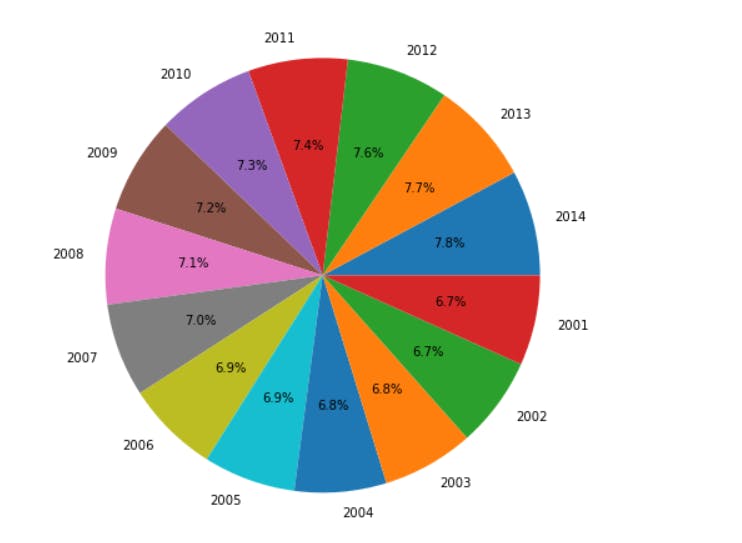
plt.figure(figsize = (10,8))
plt.pie(crime_year.values, labels = crime_year.index, autopct='%1.1f%%')
plt.show()
Women crime Analysis based on years -
Make a copy of the dataframe.
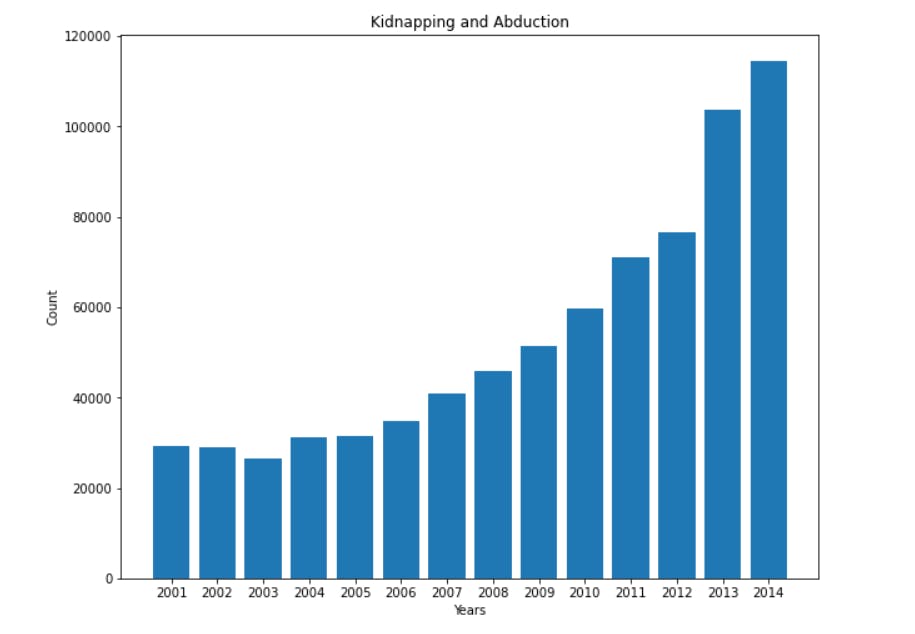
Use a for loop, and loop it over to various crimes against women and group it by Year column. It shows the plot of a particular crime over the years.
crime_df2 = crime_df.copy()
cols = ['Rape','Kidnapping and Abduction', 'Dowry Deaths','Assault on women with intent to outrage her modesty','Insult to modesty of Women', 'Cruelty by Husband or his Relatives','Importation of Girls']
for i in cols:
    crime_i = crime_df2.groupby("Year")[i].sum()
    plt.figure(figsize = (10,8))
    plt.bar(crime_i.index, crime_i.values)
    plt.xticks(crime_i.index)
    plt.xlabel("Years")
    plt.ylabel("Count")
    plt.title(i)
    plt.show()
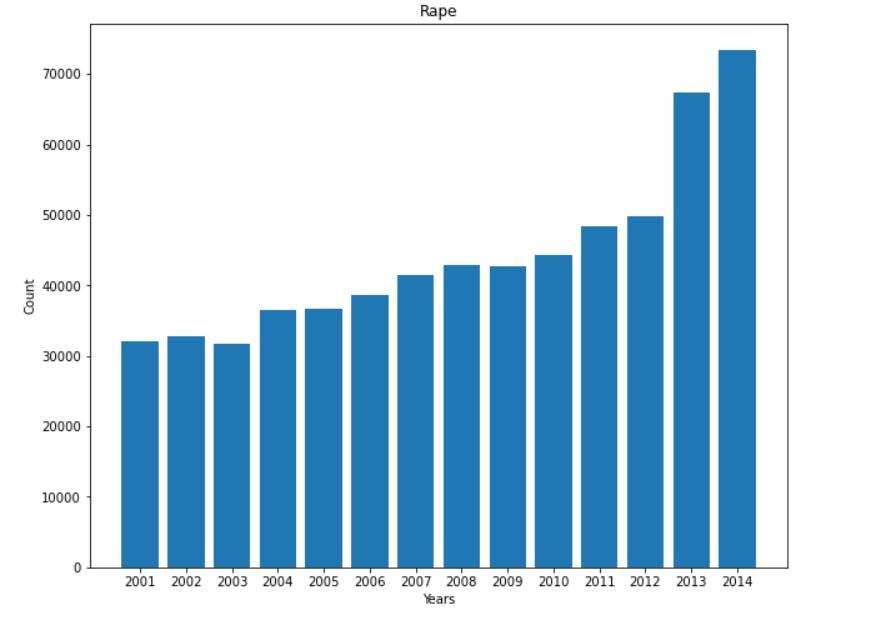 Over the years, rape cases have continued to increase.
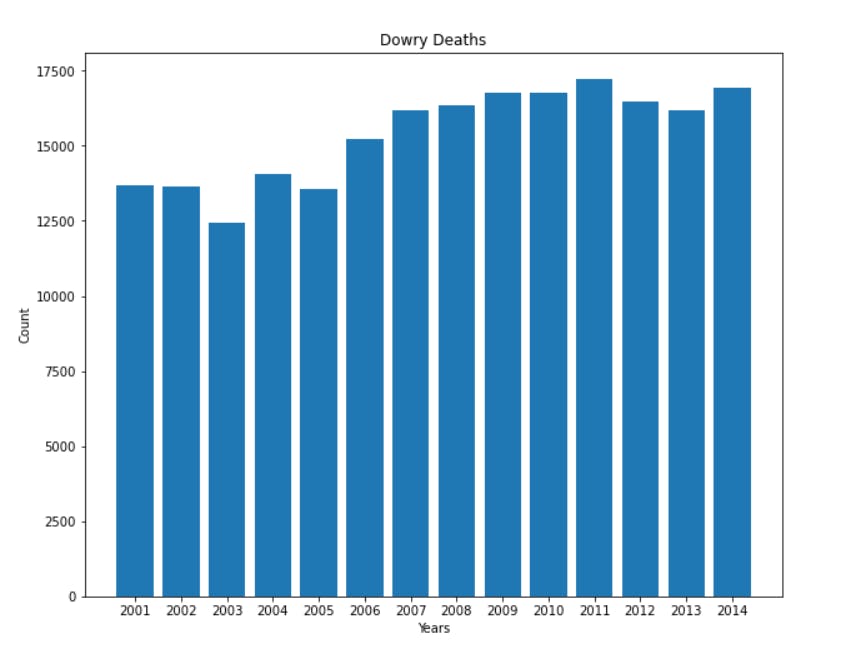 There was no particular trend observed in this case.
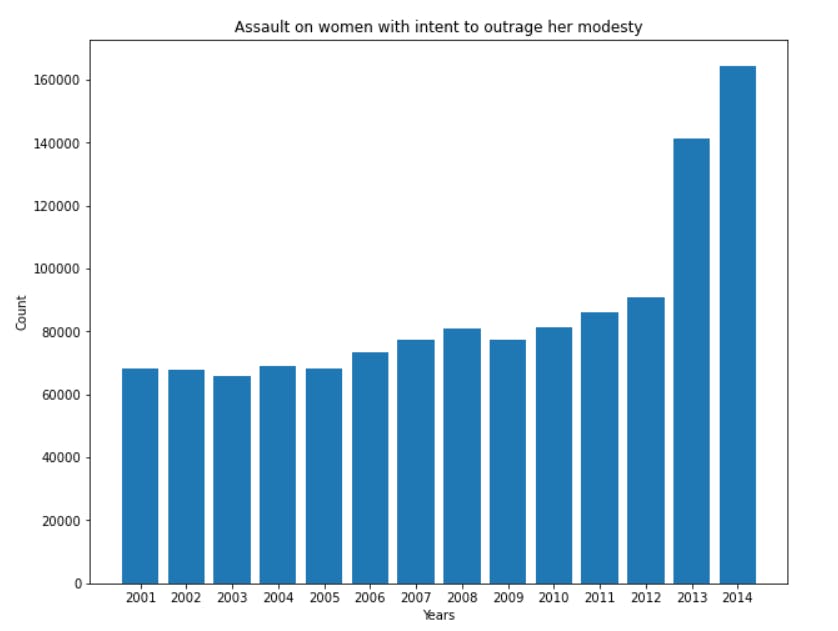 The number of cases recorded for assault has drastically increased in the year 2013 and 2014.
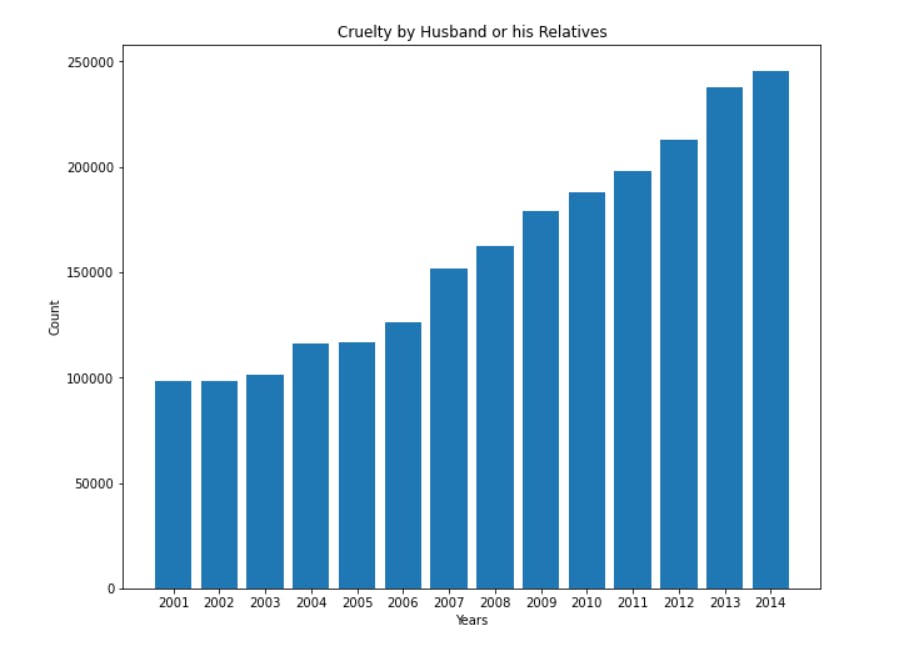 The cases of cruelty by husband or his relatives kept on increasing gradually from the year 2001 till 2014.
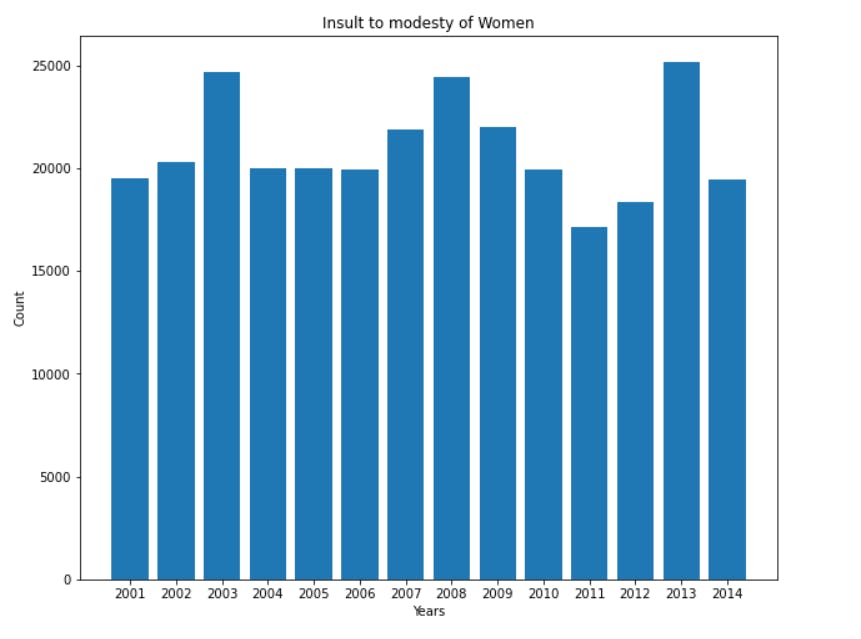
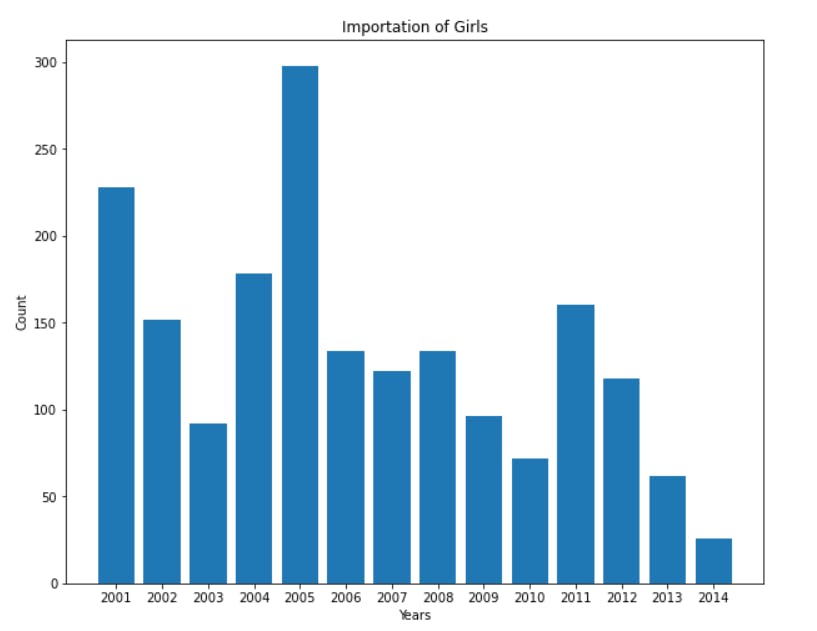 The number of cases recorded for the Importation of girls was minimal in the year 2014.
Counts of each crime -
cols1 = ['Rape','Kidnapping and Abduction', 'Dowry Deaths','Assault on women with intent to outrage her modesty','Insult to modesty of Women', 'Cruelty by Husband or his Relatives','Importation of Girls']
list1 = []
for i in cols1:
    counts = crime_df[i].sum()
    list1.append(counts)
list1

plt.figure(figsize = (10,8))
plt.plot(cols1, list1)
plt.xticks(rotation = 90)
plt.show()
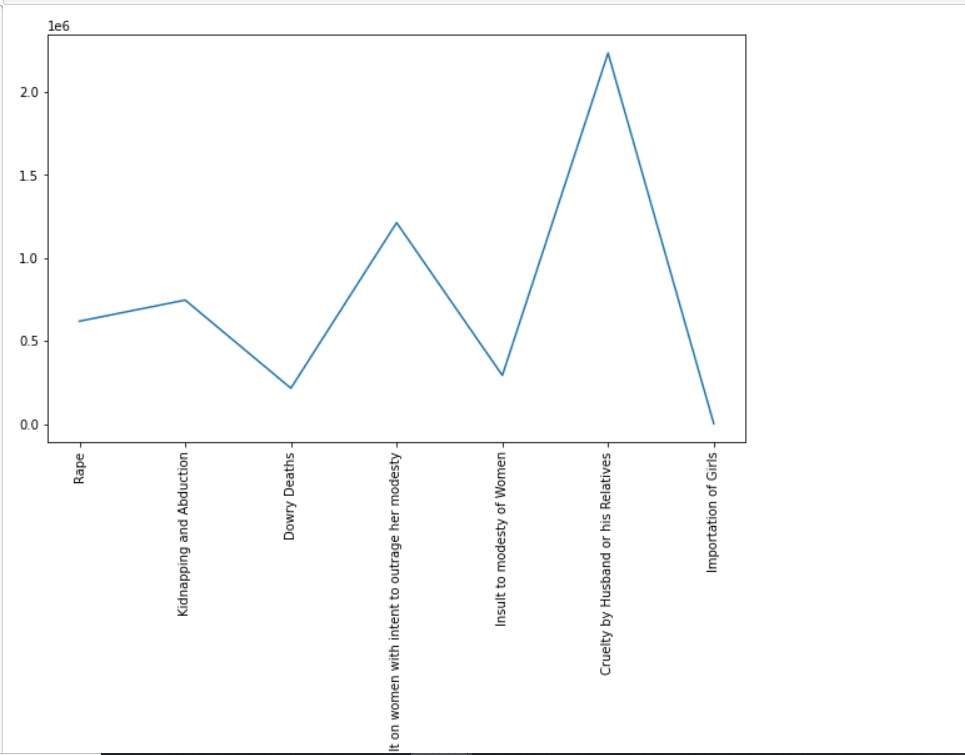 India has the highest cases of "Cruelty by husband or his relatives" from the year 2001 till 2014.
Women crime Analysis based on states -
cols2 = ['Rape','Kidnapping and Abduction', 'Dowry Deaths','Assault on women with intent to outrage her modesty','Insult to modesty of Women', 'Cruelty by Husband or his Relatives','Importation of Girls']
for i in cols2:
    crime_i = crime_df2.groupby("STATE/UT")[i].sum().sort_values(ascending=False)
    plt.figure(figsize = (18,8))
    plt.bar(crime_i.index, crime_i.values)
    plt.xticks(crime_i.index)
    plt.xticks(rotation = 90)
    plt.xlabel("State")
    plt.ylabel("Count")
    plt.title(i)
    plt.show()
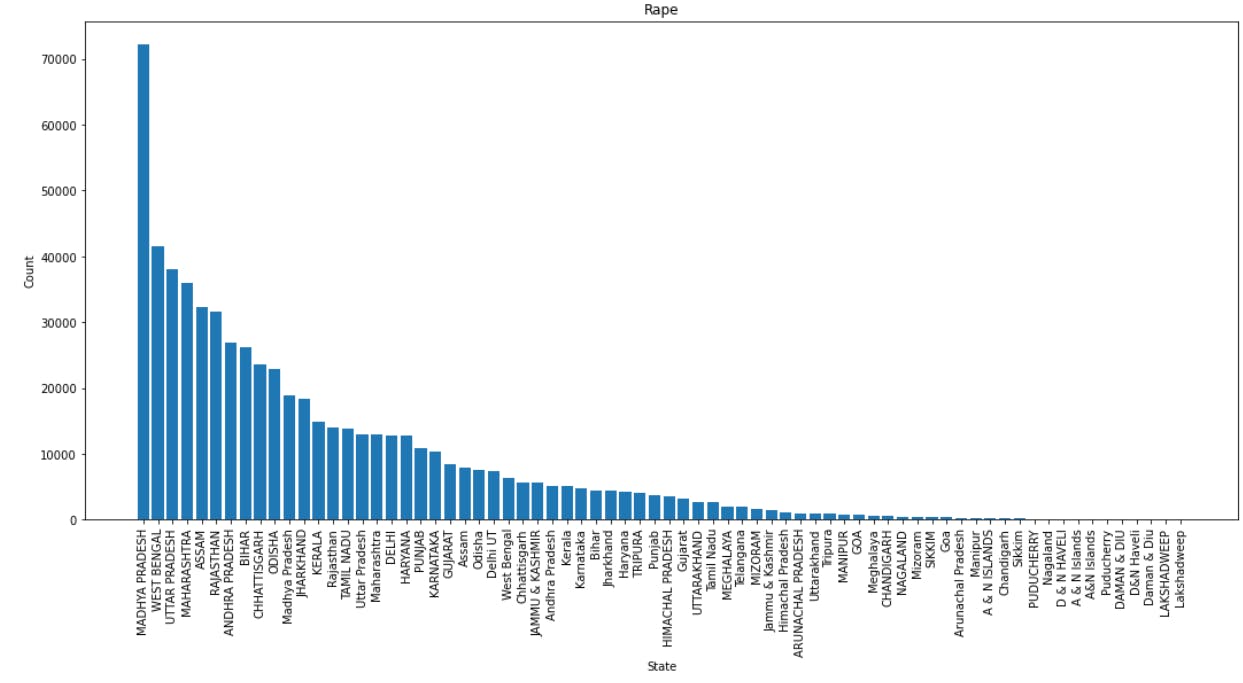 Madhya Pradesh has the highest number of cases recorded of 'Rape'.
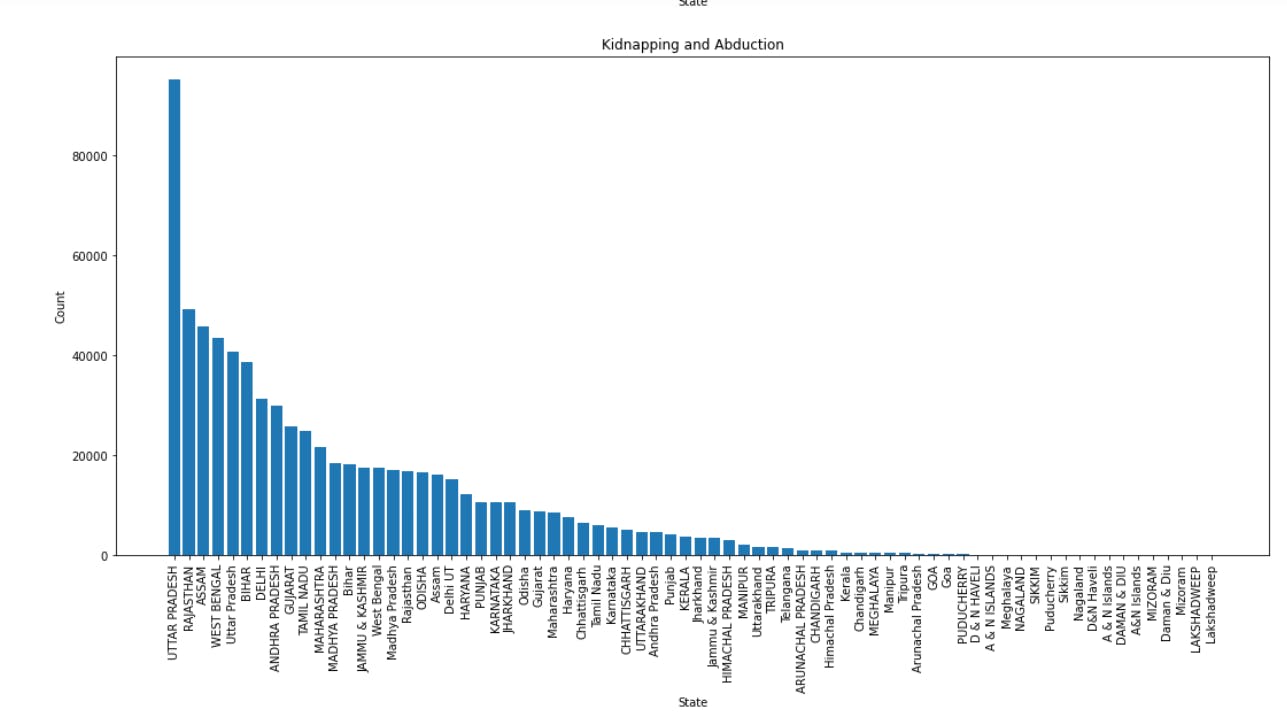 Uttar Pradesh has the highest number of cases recorded of 'Kidnapping and Abduction'.
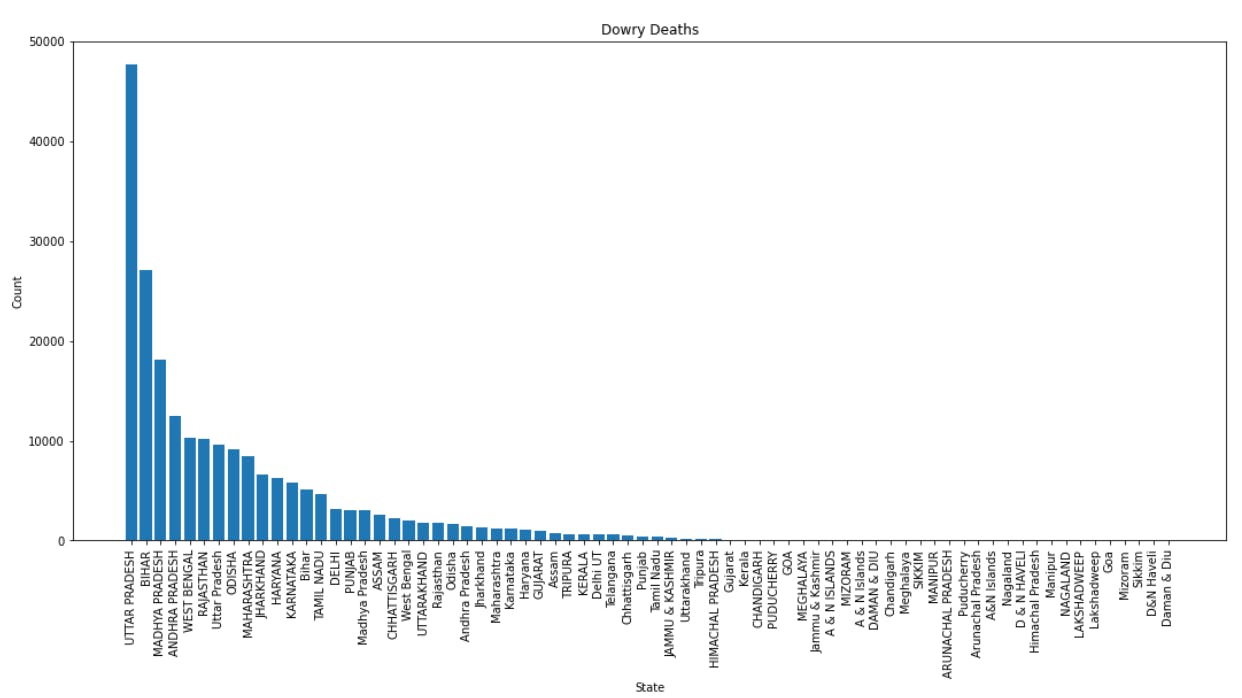 Uttar Pradesh records the highest number of cases of 'Dowry Deaths'.
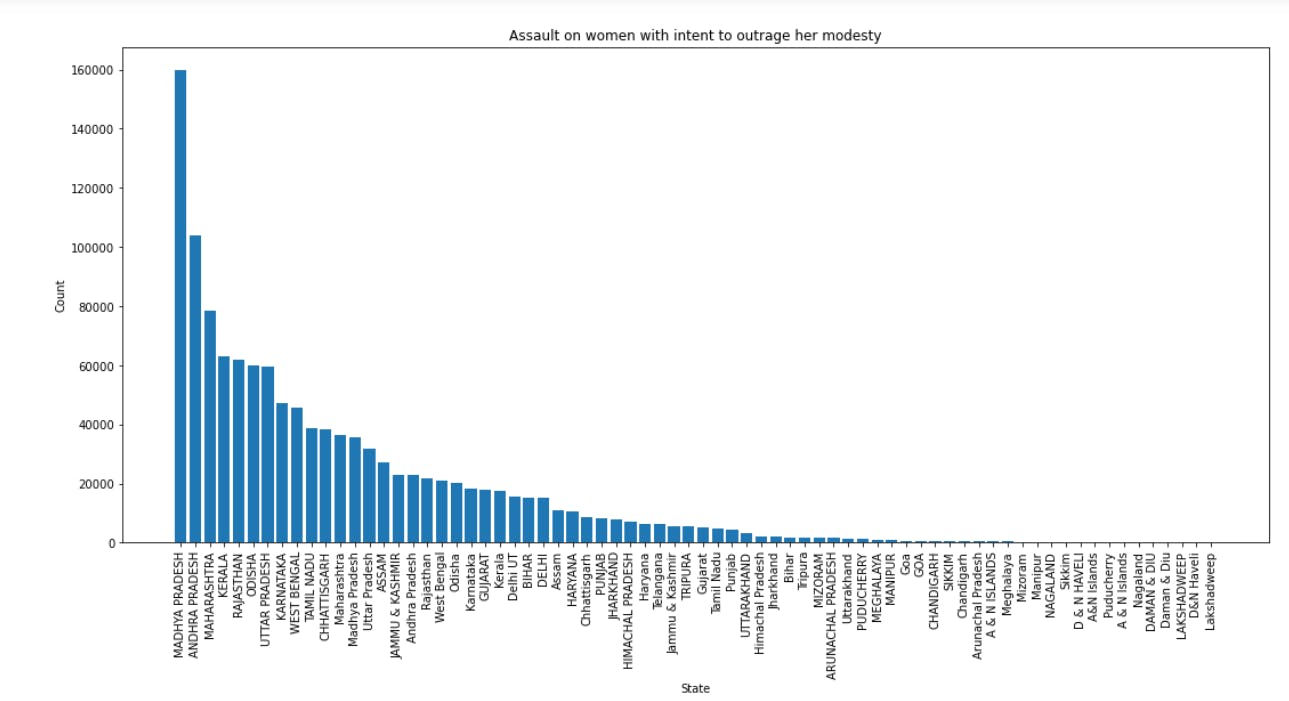 Madhya Pradesh records the highest cases of 'Assault on women with intent to outrage her modesty.
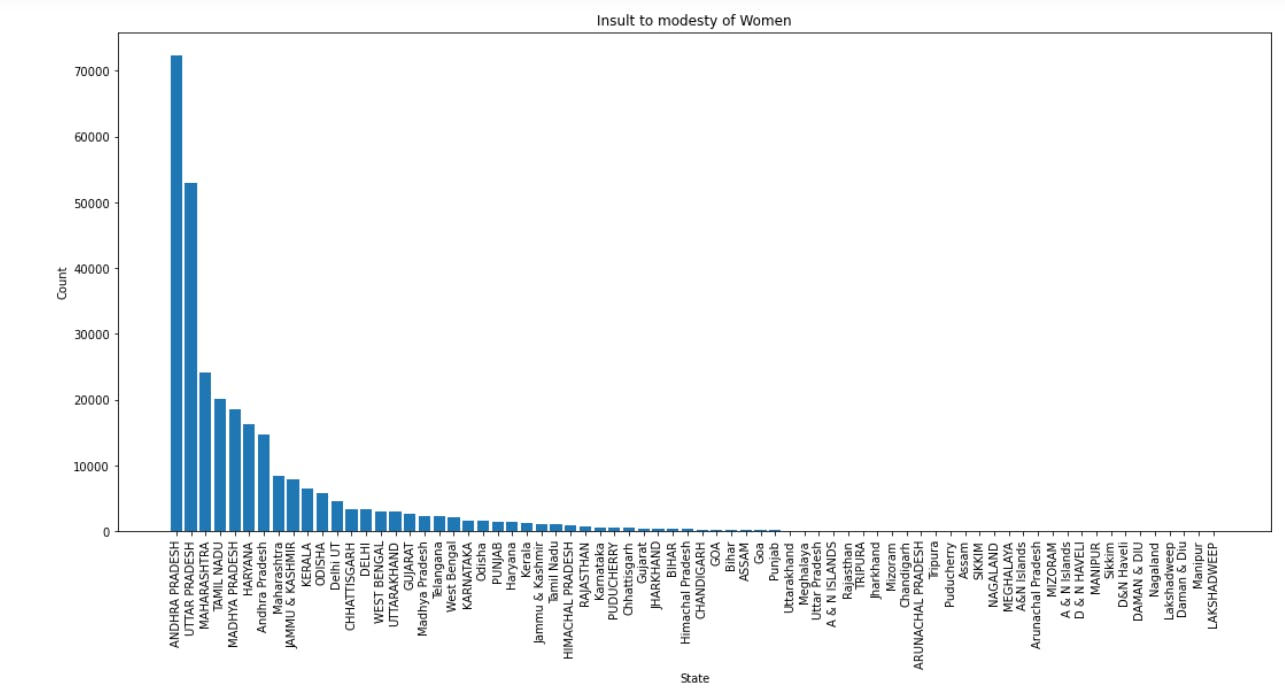 Andhra Pradesh records the highest cases of 'Insult to the modesty of women'.
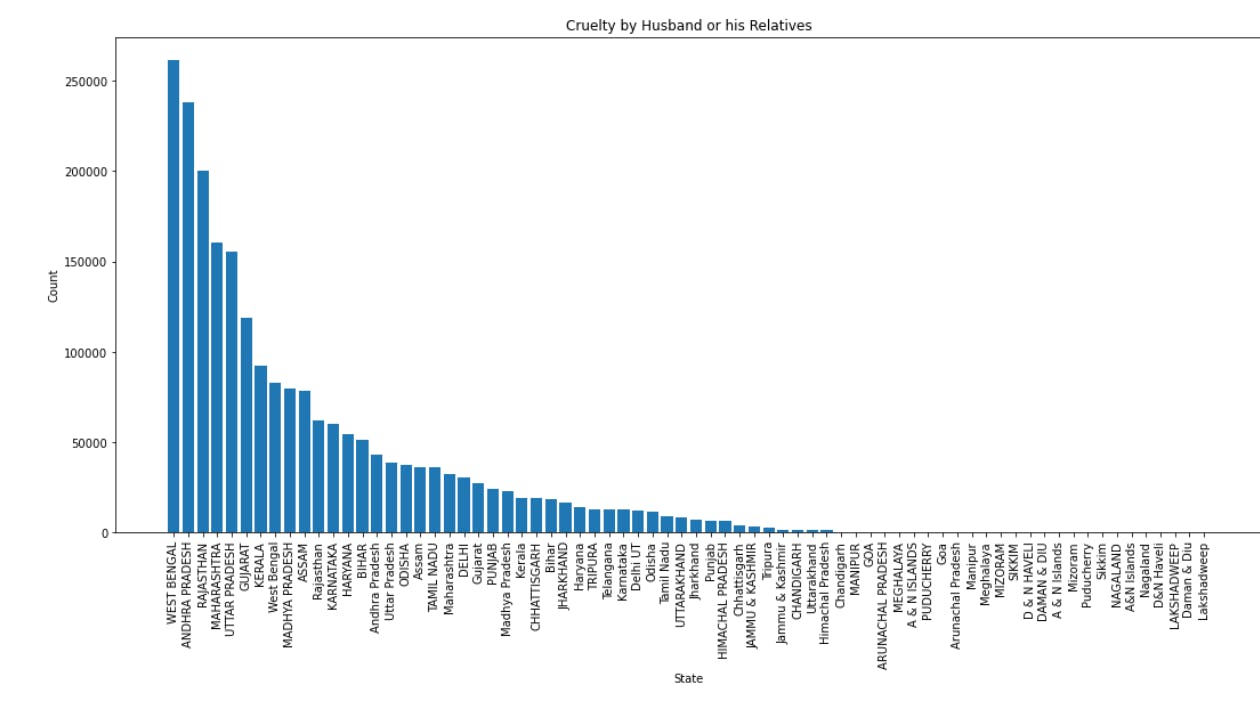 West Bengal records the highest cases of 'Cruelty by husband or his relatives'.
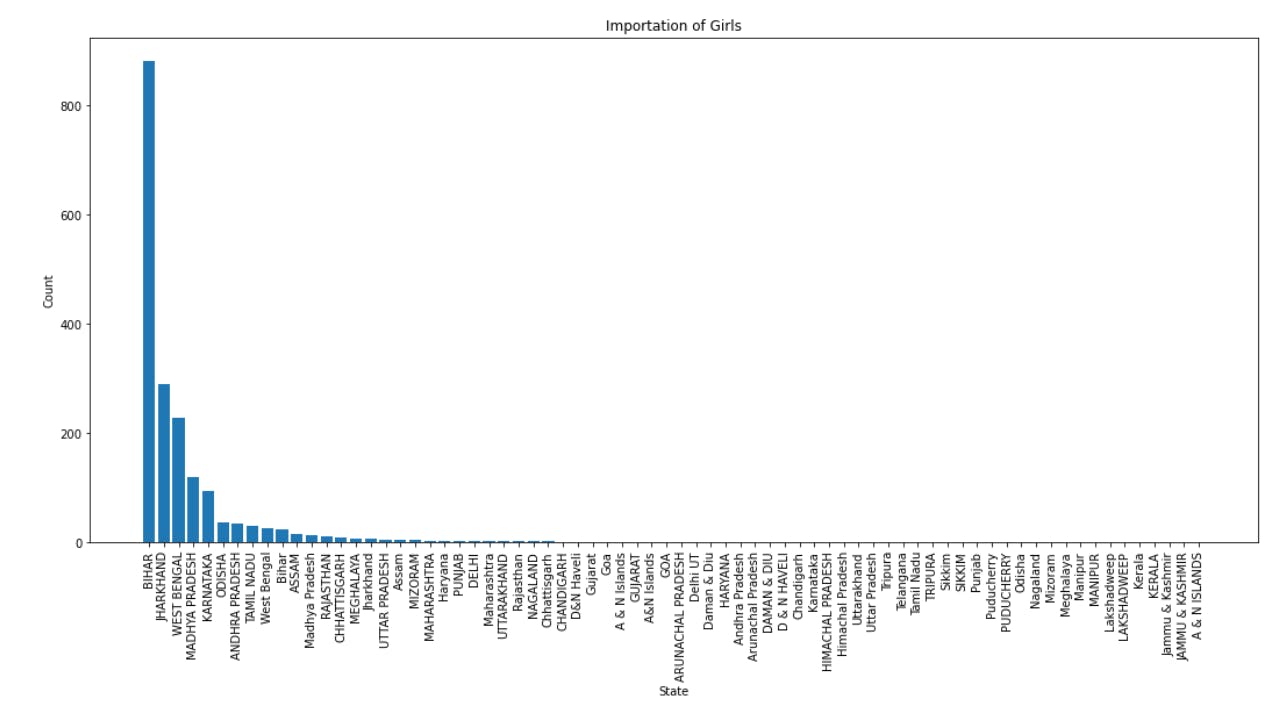 Bihar records the highest cases of 'Importation of girls'.
To count the crime rates of each district in Uttar Pradesh -
Make a copy of the data frame.
Filter the dataframe based on the state column.
To count the crime rates of each district in Uttar Pradesh.
crime_UP = crime_df.copy()
Crime_UP = crime_UP[crime_UP["STATE/UT"] == "UTTAR PRADESH"]
Crime_UP
UP = Crime_UP["DISTRICT"].value_counts()
UP
To conclude, crime against women in India is high and it's the need of the hour to take appropriate measures against the culprits to make this nation a safe haven for women.
Hope you found this analysis helpful. Thank you😄