


This blog is about the Bike-Share Capstone project from Coursera's Google Data Analytics specialization.
You can find the certification course at - https://www.coursera.org/professional-certificates/google-data-analytics
In this blog, I am going to showcase my journey in form of Q&A. This will help you understand my thought process which you can apply to many other projects.
Section 1: ASK
What is the problem you are trying to solve?
Business Objective: To maximize the number of annual memberships by converting casual riders to annual members.
How can your insights drive business decisions?
The effort to find out trends on how the usage of cycles for annual members differ from the casual riders with the help of visualizations and key findings that will help to make recommendations that can be considered by the company in order to increase the annual memberships.
Section 2: PREPARE
The dataset required for this business objective should be of the past 12 months. Here, we are considering data from July 2020 till June 2021.
The data was made available by Motivate International Inc. under the appropriate license which ensures credibility of the data. This is public data that you can use to explore how different customer types are using Cyclistic bikes.
The data file consisted of different folders for each month of a particular year and also quarterly data year wise was made available.
As we had to consider only the data related to the past 12 months, I downloaded the csv files as per the requirement and stored it in a single folder so they are easier to access and work on.
The data-privacy issues prohibit you from using riders’ personally identifiable information. This means that we won’t be able to connect pass purchases to credit card numbers to determine if casual riders live in the Cyclistic service area or if they have purchased multiple single passes. This ensures data integrity.
Dataset - rb.gy/agptn7
Section 3: PROCESS
I am using Python language for working on data as it is more accessible and easier to use.
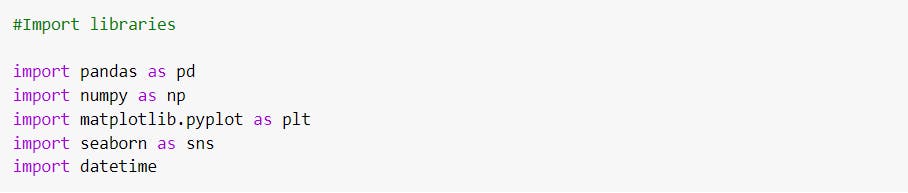
The first step while starting any analysis is to import appropriate libraries in the notebook.
Some of the important libraries are:
- Pandas - Pandas allows importing data from various file formats such as comma-separated values (CSV), JSON, SQL, Excel. Pandas allows various data manipulation operations such as merging, reshaping, selecting, as well as data cleaning, and data wrangling features.
- Numpy - It can be used to perform a number of mathematical operations like trigonometric, statistical, and algebraic on arrays.
- Matplotlib and Seaborn - It is used to create graphical analysis of the data.
- Datetime - These classes provide a number of functions to deal with dates, times and time intervals.
 Then, the data files are imported in the notebook. As we are working on the dataset of the past 12 months, we have one csv file per month. Therefore we have to import 12 files, convert them into a dataframe and merge them together in a single dataframe using Pandas.
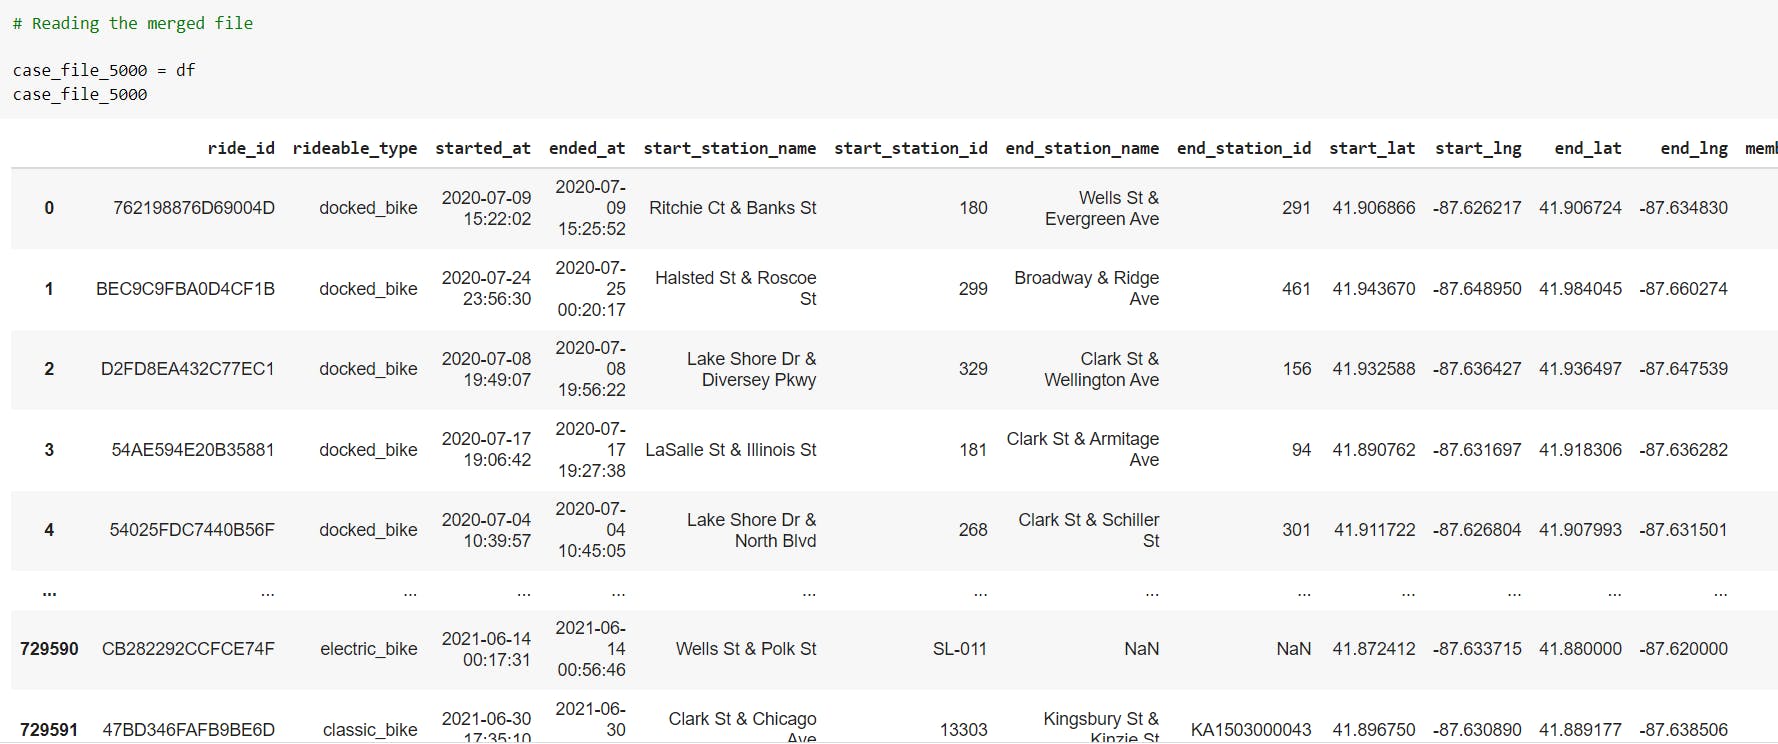
 We then read the dataframe in the Jupyter notebook to understand the data.
 We check the data type of all the columns present in the dataframe and convert the data type of columns as per our requirement.
For eg: We can convert the Object data type to Datetime.

 Also, we have to add new columns in the dataframe.
For example:
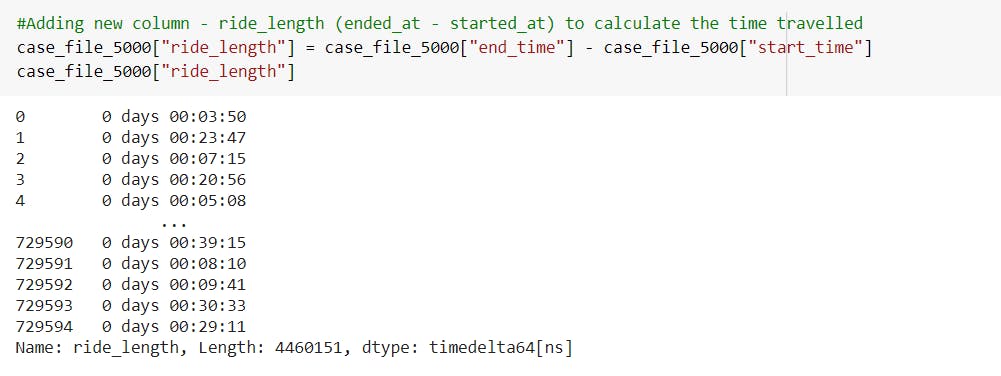
-In order to find the ride length between start and end location, we subtract the values in those columns and create a new column to store values.
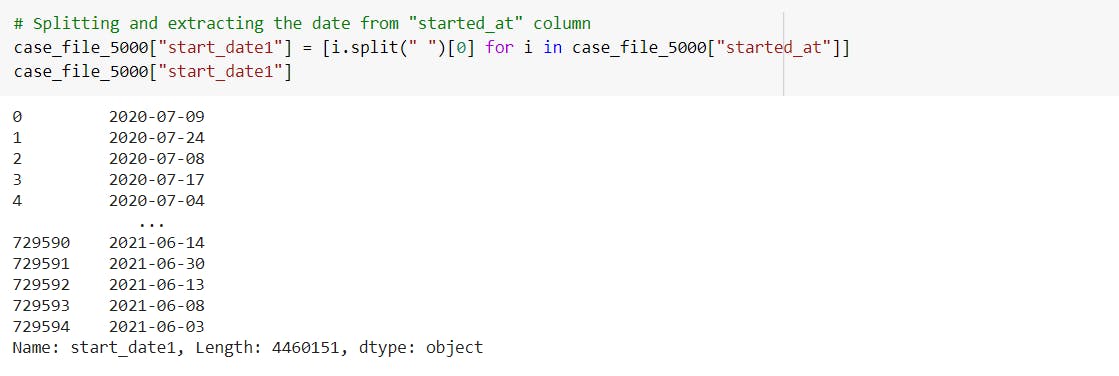
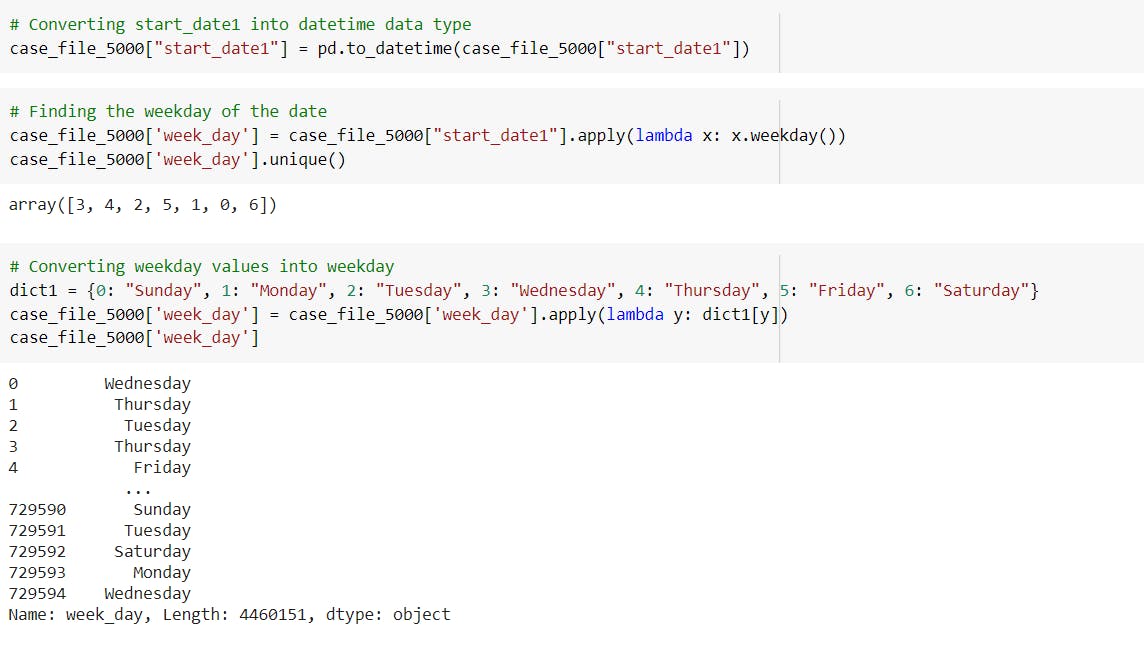
 -To extract only the date from the started_at column, convert it to datetime data type and store it into a new column.
 -Create a new column week_day in order to determine the day of the week(Sunday, Monday,...) of the date present in another column.
Also, we convert the values obtained, into weekday values with the help of a python dictionary.
Note - The next step is to clean the columns, I have listed out the whole cleaning process in detail below. Please check out that section.
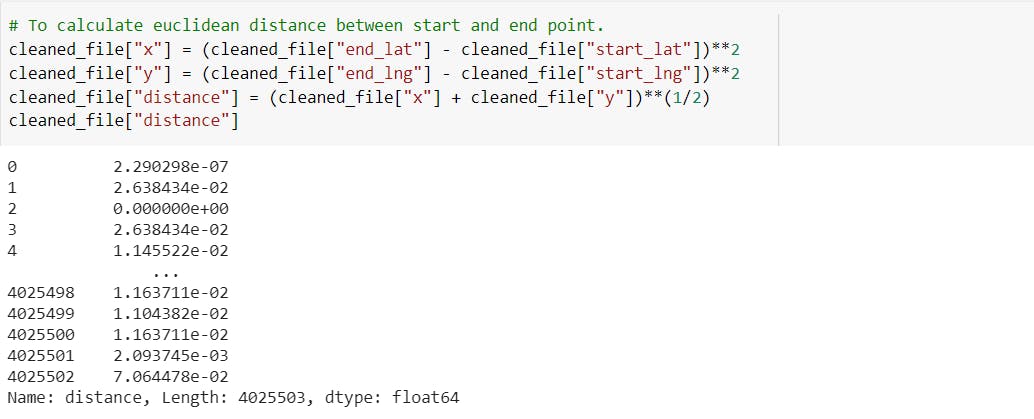
-Create a new column for calculating distance between start and end points with the help of Euclidean distance formula.
 -We can also extract the year and month from the start date and store the values in new columns.
 The next step was to sort data in an ascending order by date.
 The most important step of the data cleaning process is to determine all the rows and columns with missing values.
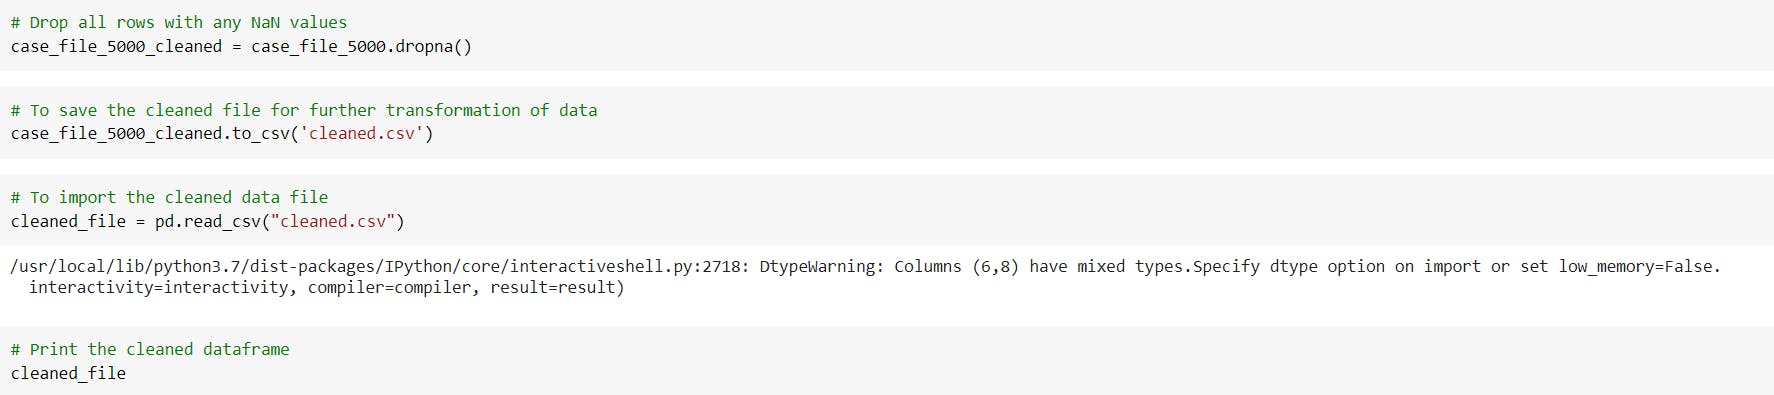
The next step is to check how we can populate the missing cells. But if the percentage of missing data is less than 3%, we can drop them without any major feedback crunch in our analysis.
In this dataset, as the number of rows having missing values was just 0.1% of the total dataset, I dropped all those rows.
If you have a large number of rows with missing values, you can fill in those values by substituting the cells based on exploratory analysis.
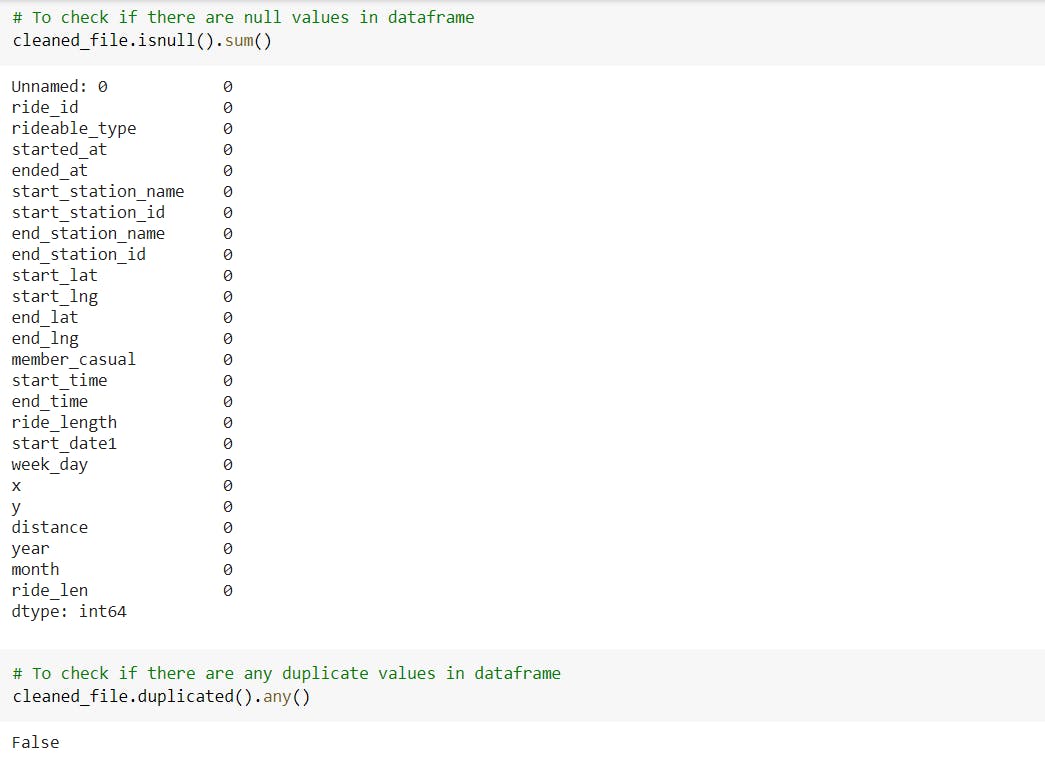
 The next step is to check whether there are any null values in the dataset or any duplicate entries present in the dataset.
 To dry run a raw version of my code, I made a smaller dataset of around 5000 rows and ran it on my personal machine in Jupyter Notebook.
And as the final dataframe consisted of approximately 4.5 million rows, it was not possible to run it on my personal device. So instead I used Google Colaboratory to run the code.
Section 4: ANALYSIS
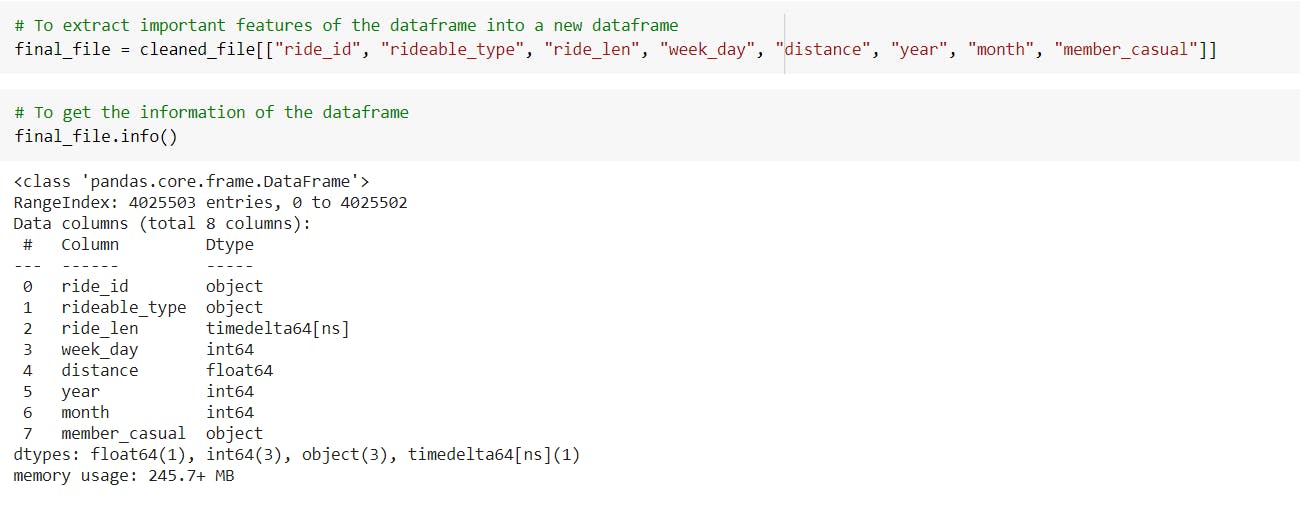
After cleaning the data, it is important to aggregate, organize and format the data. Here we need to perform calculations(descriptive analysis) and understand the trends present in the data. Following are the analysis I did and the outcomes I observed:
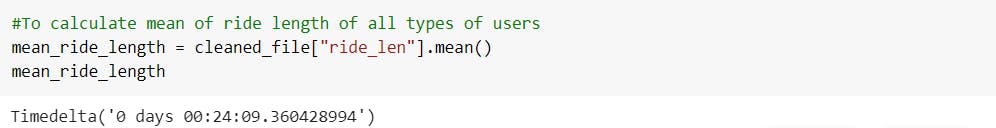
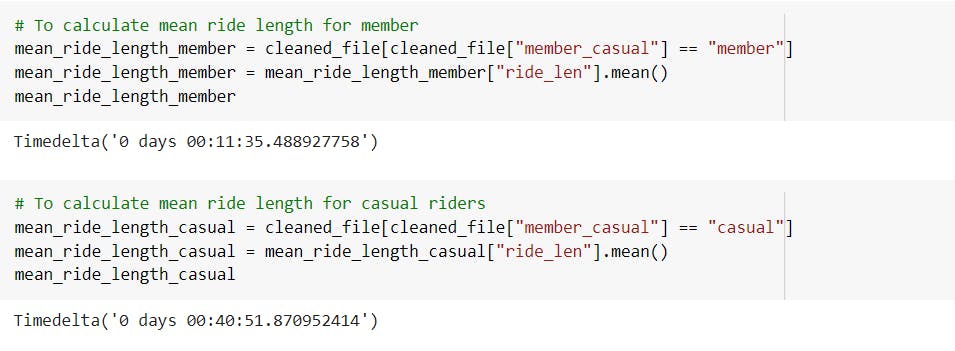
-Calculated the mean ride length of all types of users, annual members and casual riders.
---> Observed that the mean ride length of casual riders was the highest.
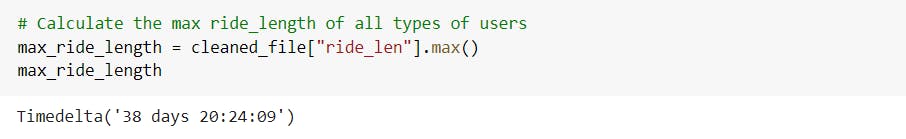
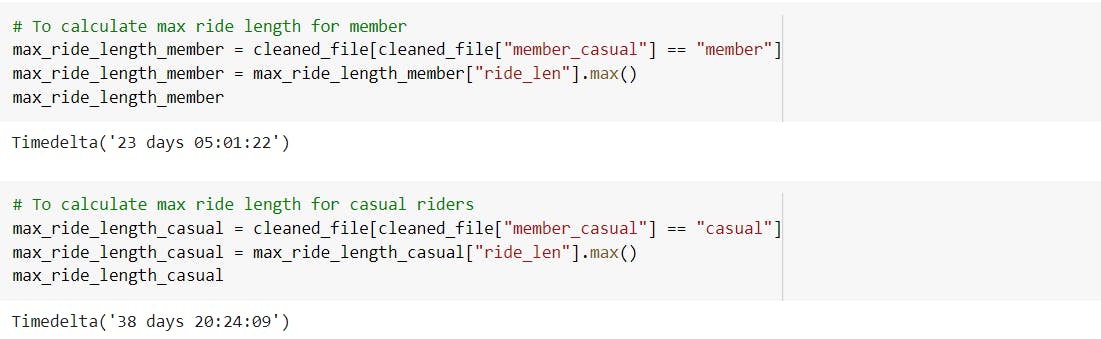
 -Calculated the max ride length of all types of users, annual members and casual riders.
---> Observed that the max ride length of casual riders was the highest.
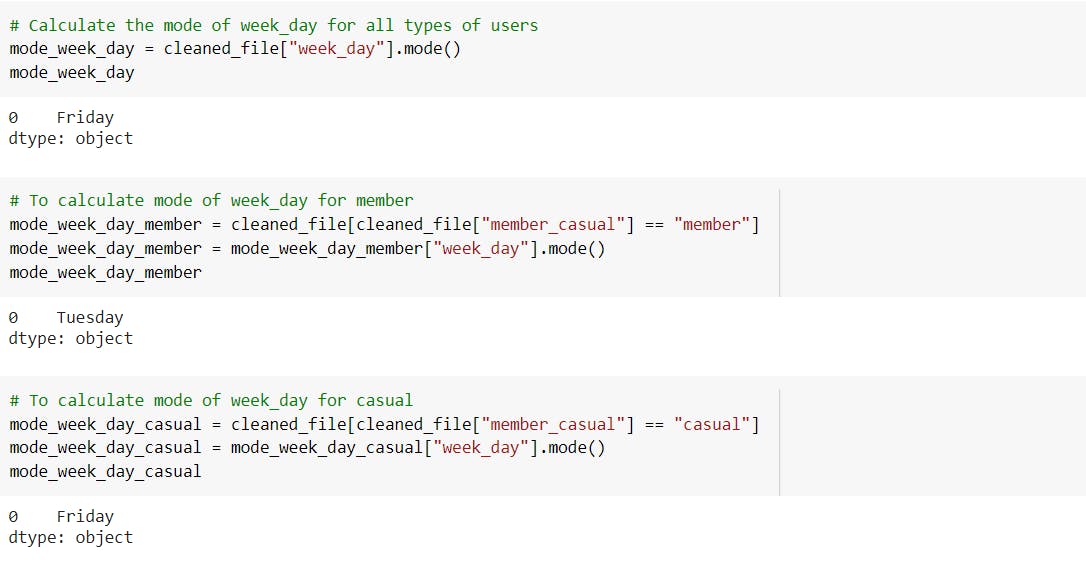
 -Calculated the mode of weekday for all types of users, annual members and casual riders.
---> Observed that the mode weekday for casual riders is “Friday” whereas for annual members it is “Tuesday”.
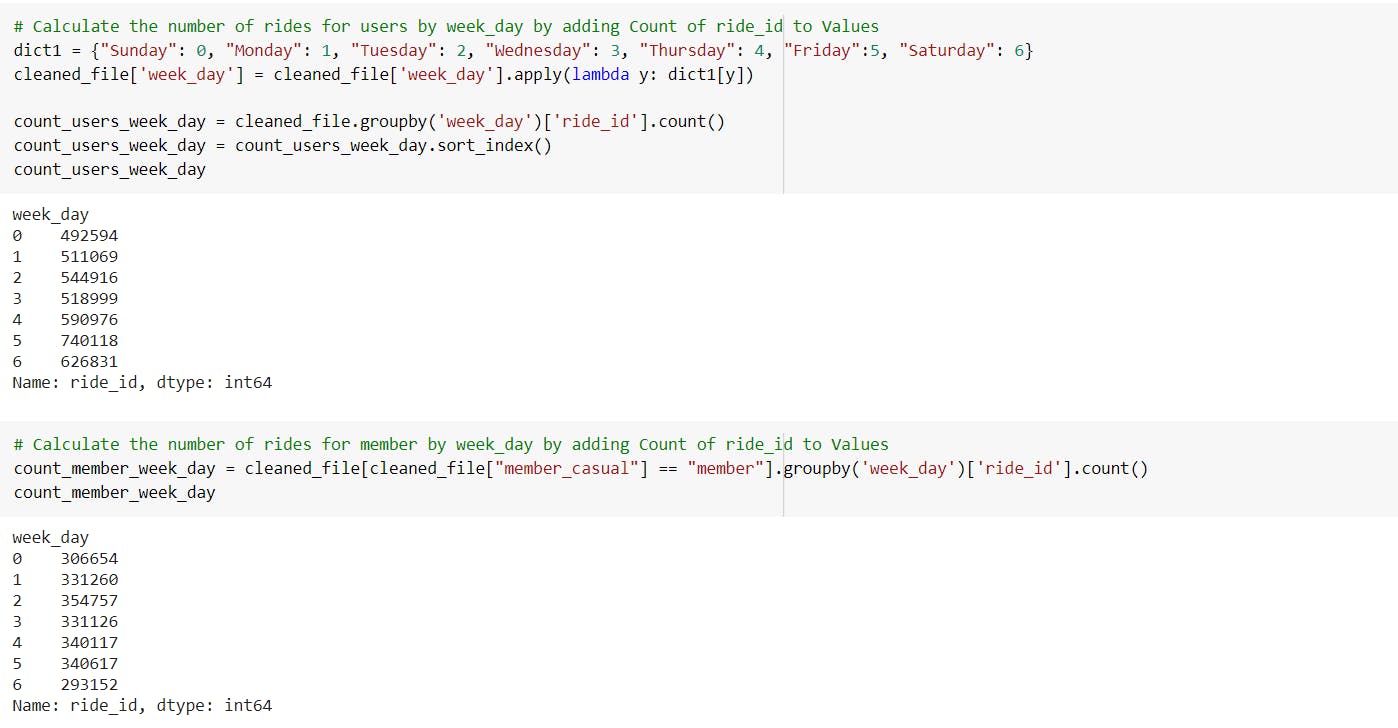
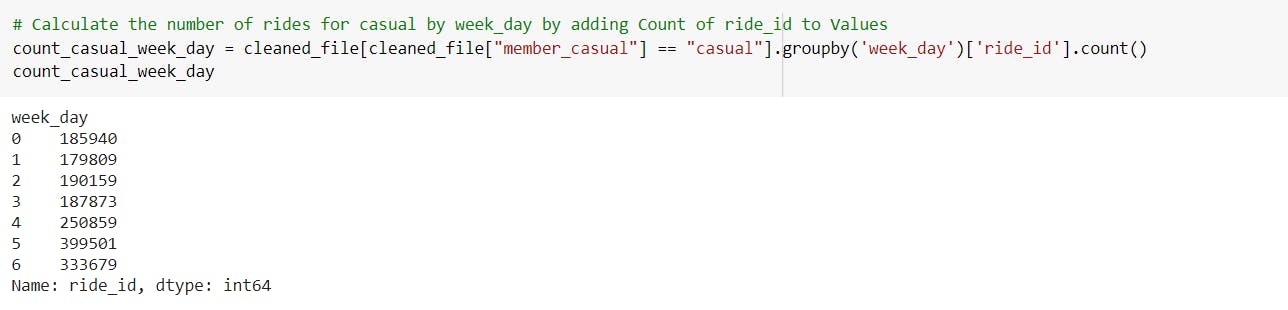
 -Calculate the number of rides for all types of users, annual members and casual riders by weekday by adding count of ride_id to values.
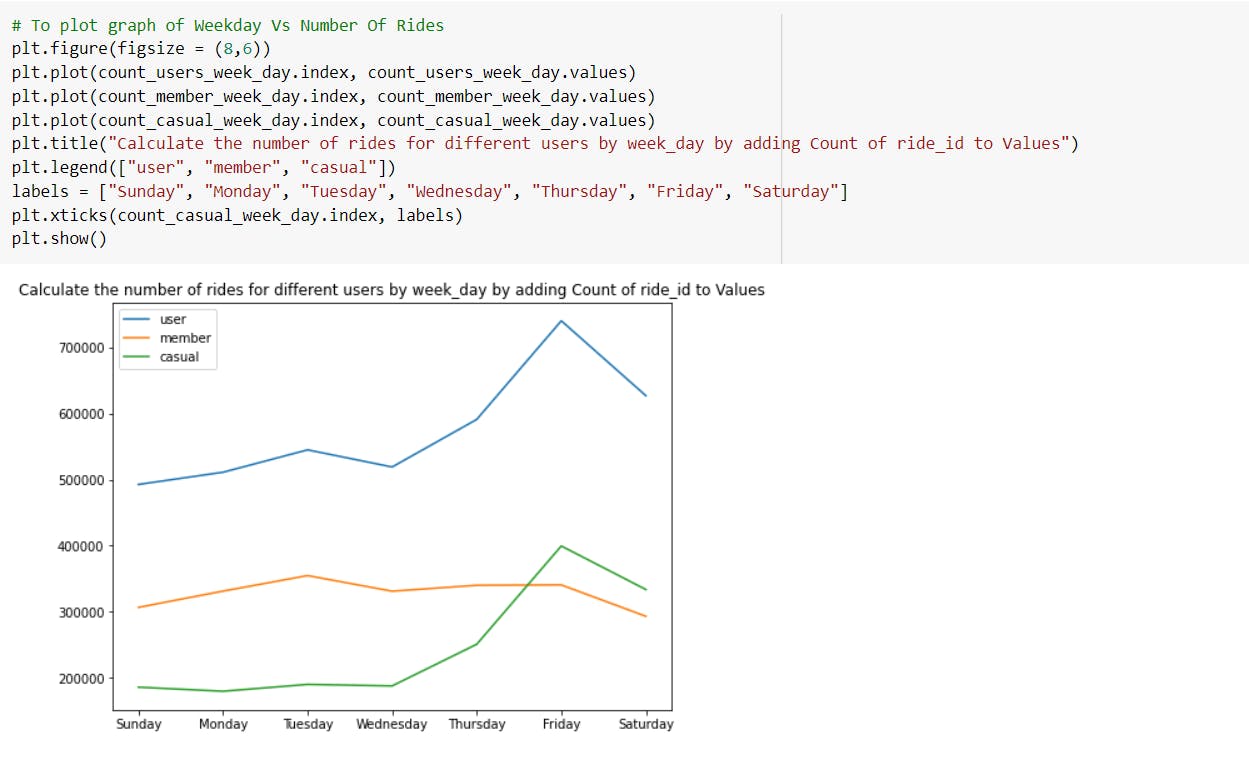
---> The maximum number of rides for casual riders was on Friday and lowest was recorded on Monday.
---> The maximum number of rides for annual members was on Tuesday and lowest was recorded on Saturday.
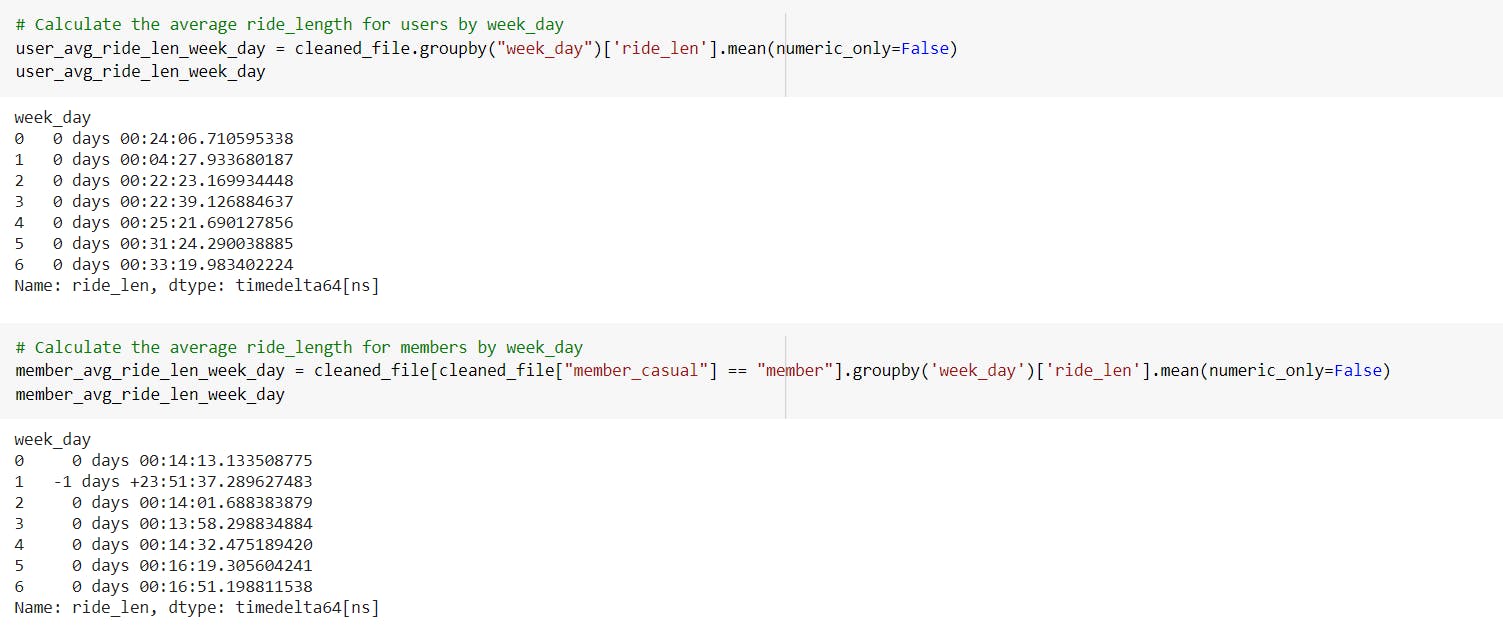
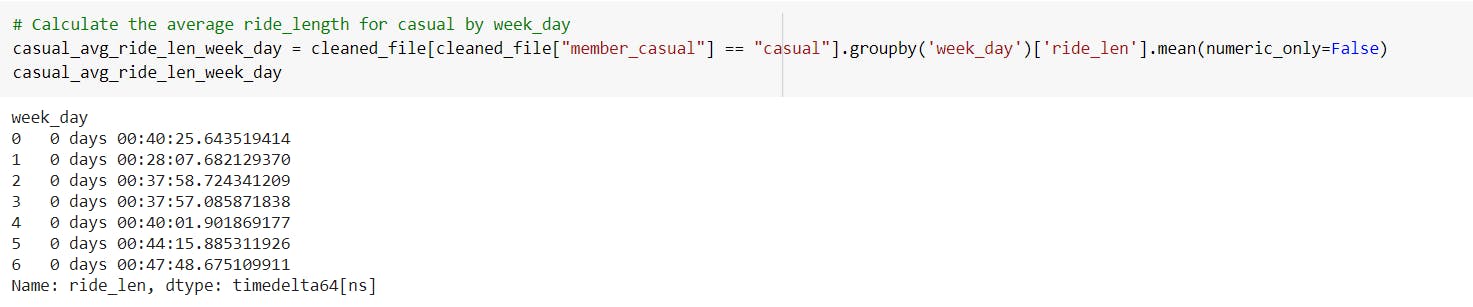
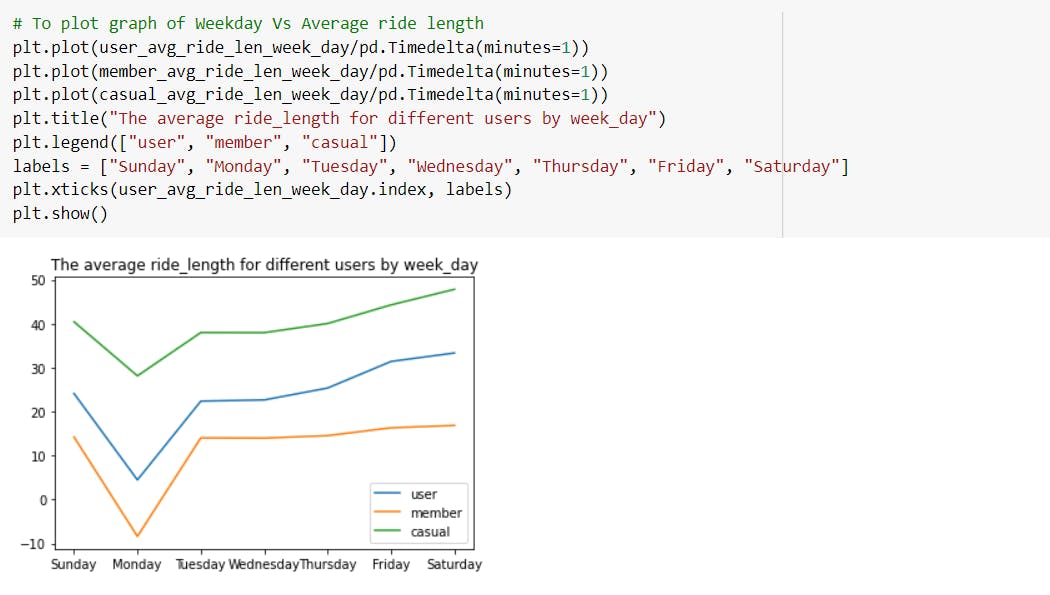
 -Calculate the average ride length for casual riders by weekday.
---> The highest average ride length for casual riders is observed on Saturday which is approximately 47 minutes.
Section 5: SHARE
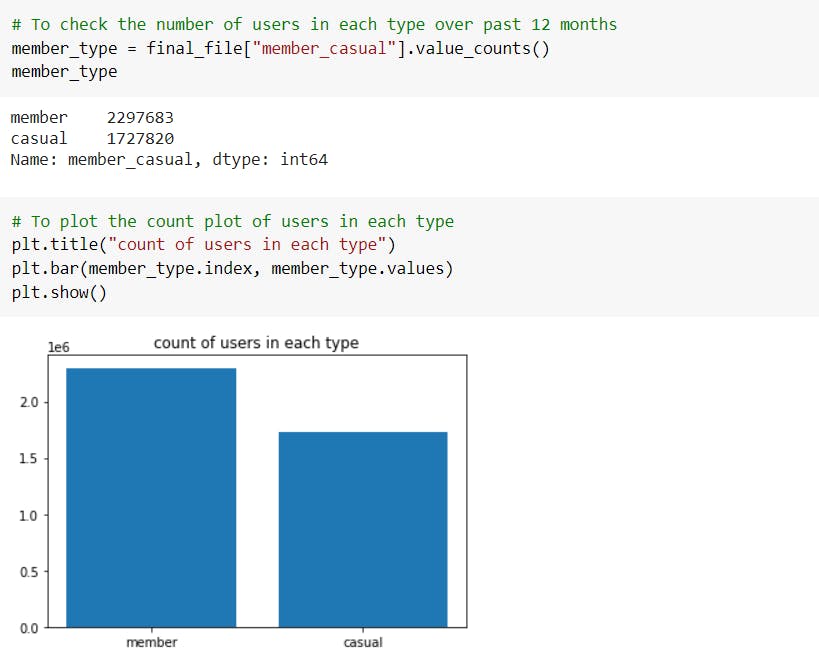
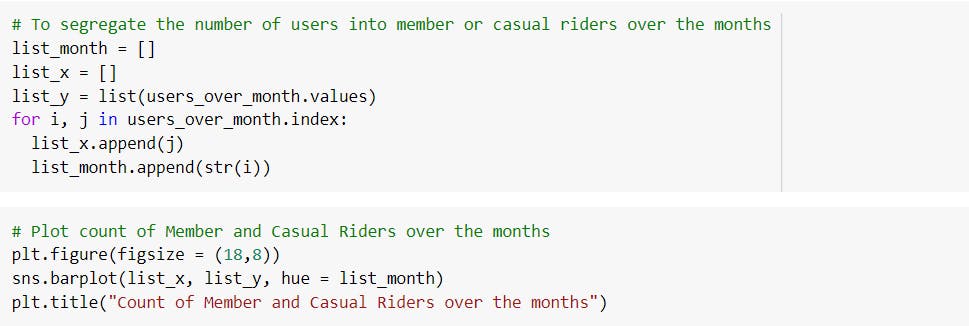
We use python libraries like seaborn and matplotlib to plot visualizations.
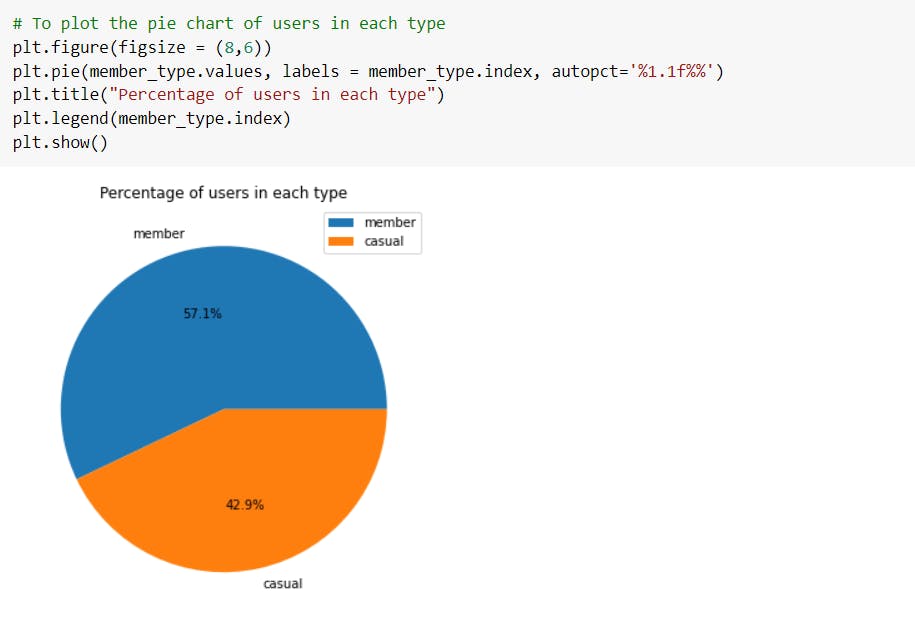
Through visualizations, we can observe that the number of casual riders is approximately equal to the number of annual members. The 57.1% of total population are annual membership holders.
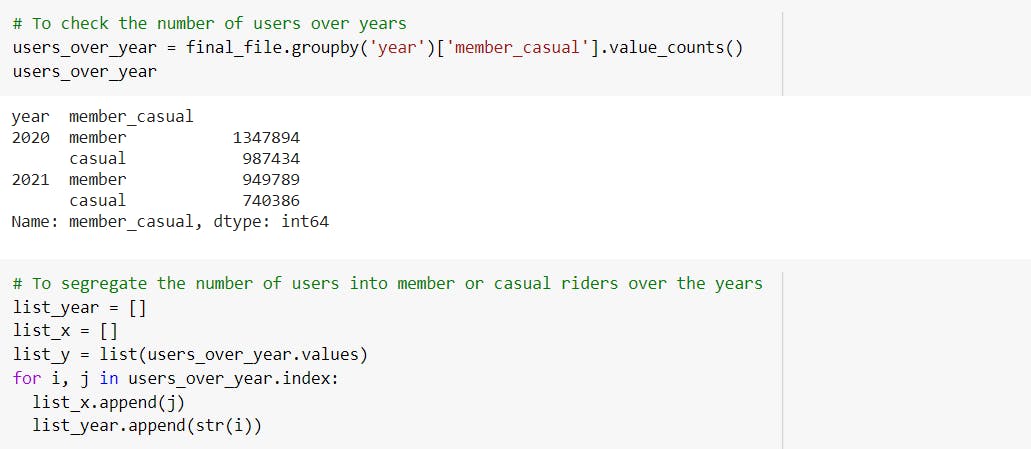
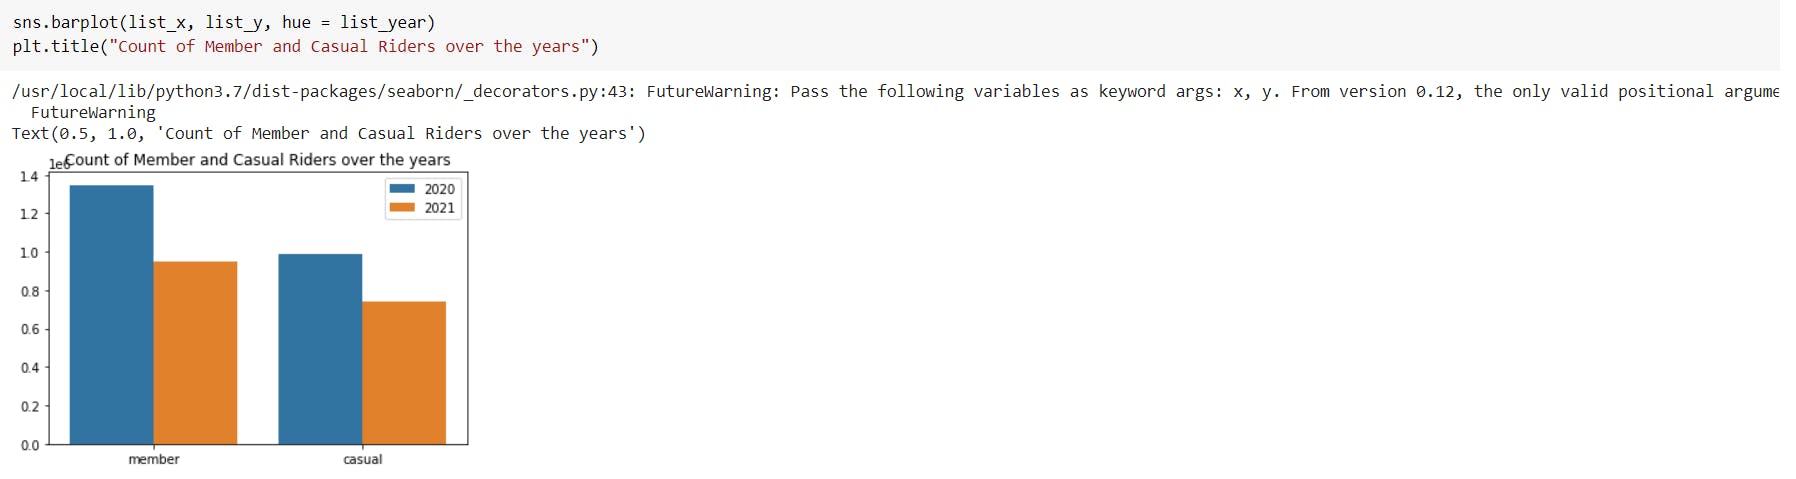
 It has also been observed that the count of both annual and casual riders have decreased in the year 2021.
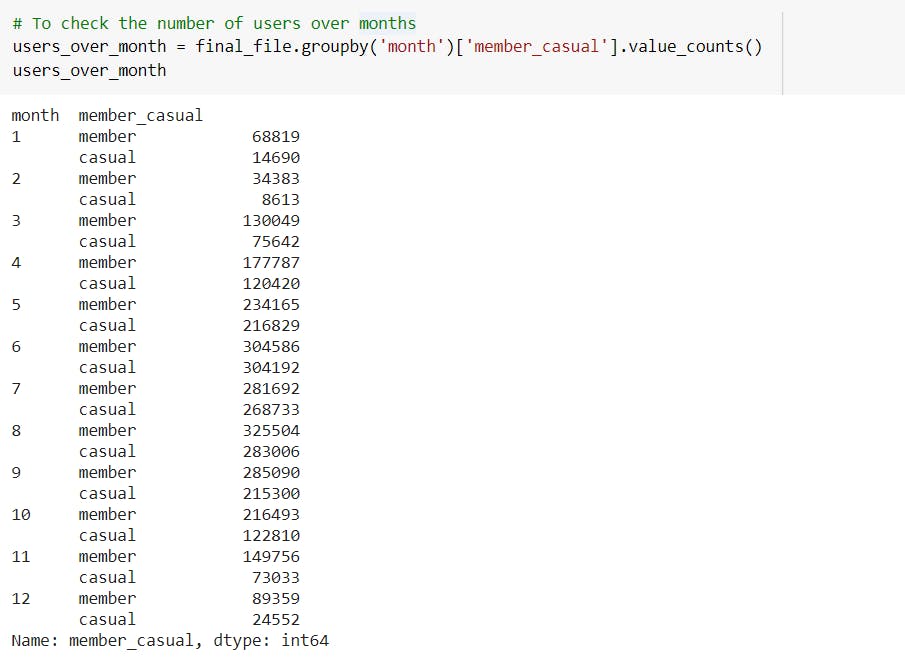
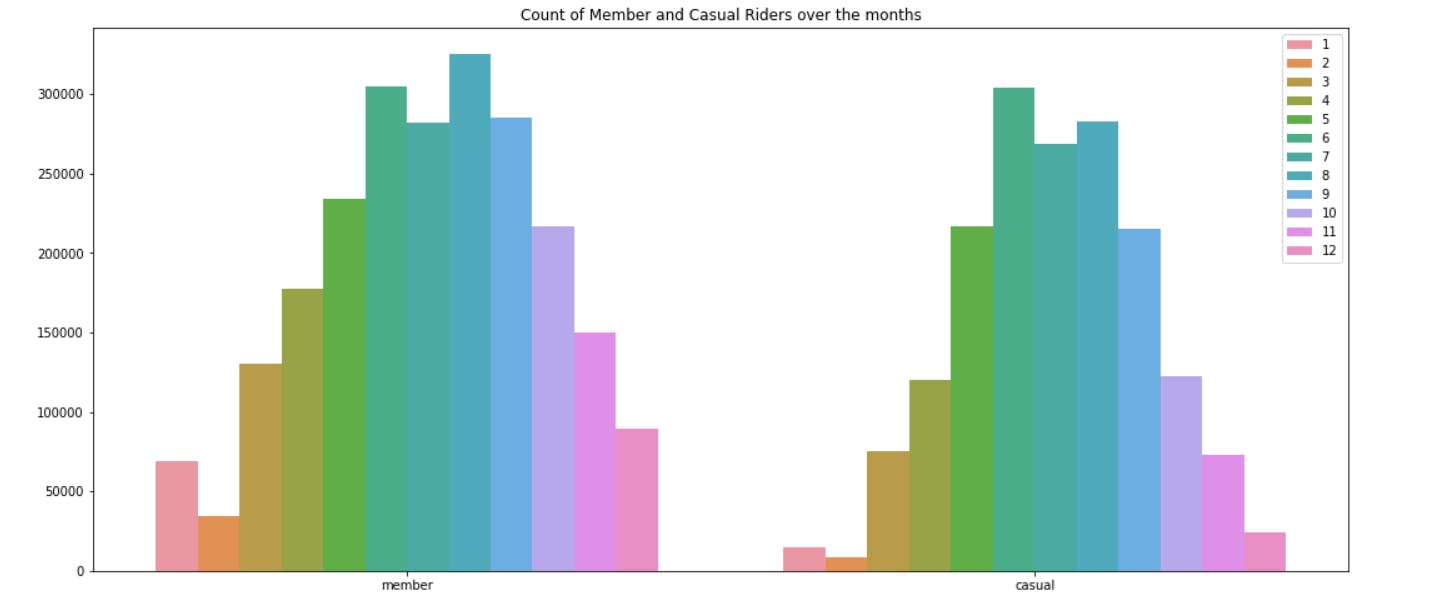
 The count of people using the services starts dropping in the month of November till February and then it again starts increasing.
Section 6: ACT
As observed from the analyses, the number of casual riders is more than the number of annual membership holders. We can increase the fare of casual rides (which will help generate more revenue initially) and at the same time, reduce the cost of annual membership. This will pull more riders towards annual membership.
As observed, most of the casual riders ride on Fridays. We can hold special weekend discounts on annual membership to attract the customers. At the same time, we can offer a guarantee of bikes being available to annual membership holders on weekends, but the same can’t be guaranteed to casual riders.
As we noticed from the graph, on average, casual riders ride for approximately 47 mins. We can have a scheme like “more discounts on more miles” where the riders can get discounts like 10% on 10 more mins of ride, 20% on 20 more mins and so on. These discounts will be used against purchase of annual membership.
We can also smoothen the process of acquiring annual membership by making the whole process simple and completing it online too. On the other hand, casual riders should come to bike centers to get their bikes. This might pull some people towards annual membership, but in the long run, this will hurt the company’s image. So we should try not to fall for this dark/anti-pattern.
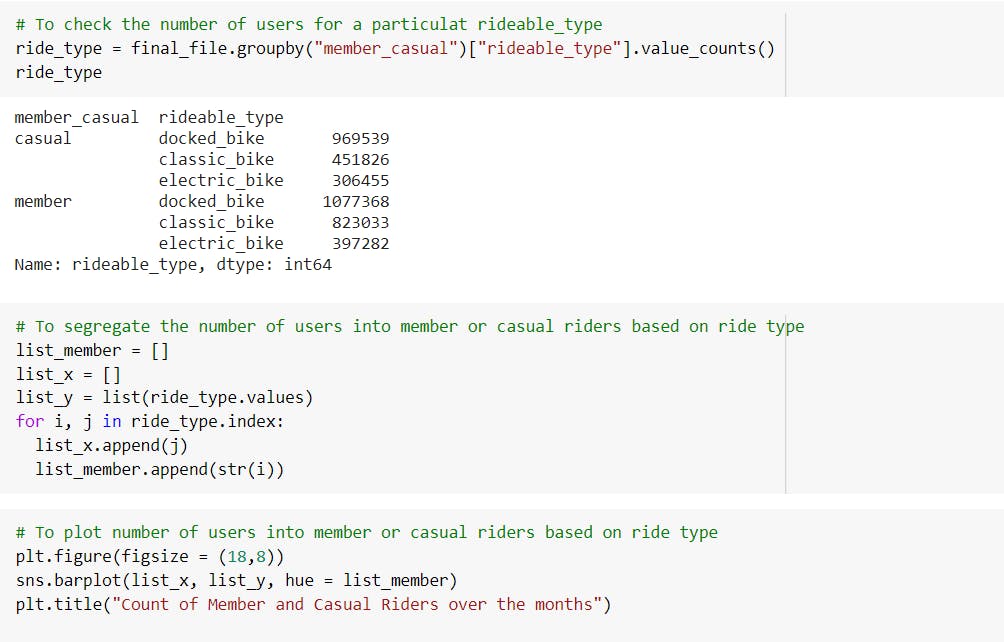
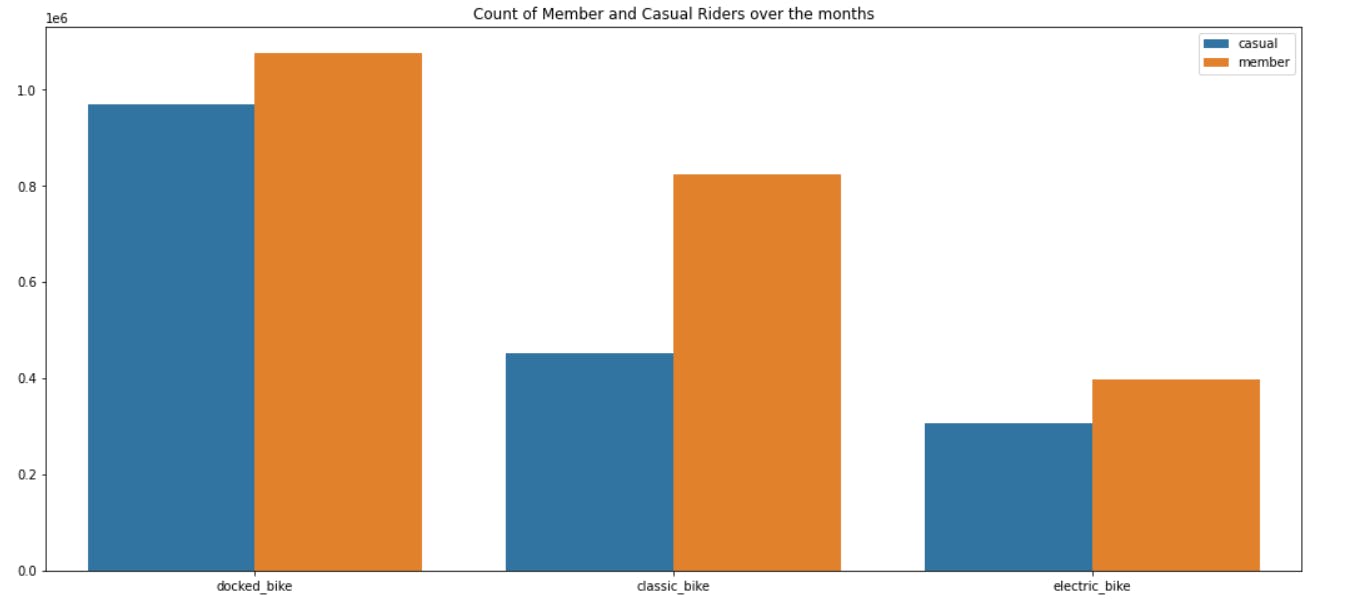
We have observed that approximately more than half of the casual members use Docker bikes for travelling, so we can offer special incentives in order to increase conversion from casual to annual.
With this, we come to an end of the Capstone Project. I have also uploaded a YouTube video where I showcase the whole code. You can check out the video and the code here!
Thank You! 😀